
Research by:
Emmanuel Kweku Quansah (Ph.D.
Nathaniel Boso (Ph.D.)
Abdul Samed Muntaka (Ph.D.)
Kwame Nkrumah University of Science and Technology (Kumasi, Ghana)
| The LMI Value for Ghana for the first quarter of 2023 is 67.1 |
The LMI for the first quarter of 2023 increased by 3.1 to 67.1 from the fourth quarter (2022) value of 64.0.
Growth is INCREASING AT AN INCREASING RATE for Inventory Levels, Warehouse Capacity, Warehouse Utilization and Transport Utilization.
Growth is INCREASING AT A DECREASING RATE for Inventory Cost, Warehousing Prices, Transportation Prices and Transportation Utilization.
The Logistics Managers’ Index recorded a value of 67.1, which is the highest reading for the overall index since its inception in March 2022. This is being driven by an increasing inventory level (61.2) and a reduction in the cost metrics of inventory (80.6), and rising transportation (91.9) and warehousing (81.2) prices. The fact that transportation and warehousing, which both contribute to the cost of holding inventory, are growing at a decreasing rate is a good indication that the high supply costs that have characterized the past two quarters is beginning to subside. This in itself is reflected in the gradually declining inflation rate in Ghana.
The rate of growth in logistics activities, which slowed down beginning September (Q3-2022) due to the high cost of inventory and the associated cost of warehousing and transportation prices, has picked up and reached a new high of 67.1. The recorded growth in logistics activities may be indicative of a general improvement in Ghana’s economic condition.
The overall LMI score is a combination of eight distinct metrics that make up activities in the logistics sector: inventory levels and costs, warehousing capacity, utilization and prices, and transportation capacity, utilization and prices. A diffusion index is used to evaluate the overall LMI with a range between 1 and 100. A reading above 50.0 indicates that logistics activities are expanding while a reading below 50.0 reflects a contraction of logistics activities.
The LMI summarizes the responses of supply chain (including operations) managers from multiple industries in Ghana. Data for the first quarter was collected from January to March 2023.
IMPORTANT TAKEAWAYS FROM THE FIRST QUARTER 2023 LOGISTICS MANAGERS INDEX
- The overall Logistics Managers Index (LMI) for Ghana for the first quarter of 2023 stands at 1, up 3.1 basis points from 2022’s fourth quarter reading of 64.0. This increase could be pointing to the beginning of a rebound in the growth of Ghana’s logistics activities because of improvements in the country’s economic condition stemming from the appreciation of the cedi against the dollar (currently at 10.7 cedis to 1 dollar, 11th April, 2023[1] – see figure 2.0) and improved inflation rates (currently 45% in March 2023, down from a two-decade high of 54.1% in December[2]).
- All the indicators for the first quarter were above the threshold of 50%. Findings from the Q1 report indicate increasing inventory levels, with several companies restocking after a period of reduced purchasing due to the high cost of doing business experienced in the last two quarters. Particularly, companies from the food and beverage industry that were affected by low inventory levels in the third and fourth quarters of 2022 have restocked in anticipation of increasing consumer demand.
- Logistics cost indicators have decreased from the previous quarter: inventory costs have decreased from 85.1 to 80.6, warehouse prices from 89.7 to 81.2 and transport prices from 95.2 to 91.9. The change in the growth trajectory of these cost metrics is welcome news for Ghana’s economy, as it points to a gradual improvement in the country’s macroeconomic condition. The slowing of global fuel prices may also have contributed to the drop in transportation prices (currently at 1.090 USD per liter)
- Warehouse capacity has increased slightly to 52 from the previous quarter’s value of 50.5. The demand for warehouse capacity slowed down in the previous quarters but shows signs of improvement in this quarter. With the rise in inventory levels, we see an increase in warehouse utilization this quarter, moving from 50.5 in the previous quarter to 52. The increased inventory levels have generated a corresponding increase in warehouse capacity utilization.
- Logistics activities are expected to continue to grow in the next quarter of 2023, with a predicted LMI of 69.3. The expected growth in the next quarter may be reflective of a return of investor confidence in Ghana’s economy as the country edges closer to finalizing a $3 billion injection of credit and inflation begins to subside going into the second quarter of the year.
- Like the LMI, the Electronic Payment System (EPS) Index increased, with the EPS rising to 67 from the previous quarter’s value of 62.9. This increase may be attributed to a gradual buildup of investor confidence in the Ghanaian economy, a recent reduction in E-levy rate and the decline in the cost of doing business in Ghana. The government’s efforts at financial inclusivity by supporting and promoting Mobile Money Interoperability service may also have played a role in the growth of EPS. We expect the EPS index to continue to grow to a projected index of 81.7 in the next quarter.
RESULTS OVERVIEW
Results from this first quarter study suggest that Ghana’s economy, overall, is rebounding from what could have been a recession last year. Economic activities seem to be picking up, and the logistics sector is growing at an increasing rate. This rebound is reflected in the LMI value of 67.1 for March 2023 (first quarter), up by 3.1 from last quarter’s 64.0 (December 2022 – fourth quarter).
Despite the growth recorded in logistics activities in Ghana, growth in Ghana’s Gross Domestic Product (GDP) has slowed down from 5.4% in 2021 to 3.2% in 2022.[3] The World Bank has attributed this decline in GDP growth to the high inflation rate (which reached 54.1% in December 2022) and increased interest rates. Both factors have led to reduced private consumption. The government’s lack of access to international capital markets has also been a contributor to the GDP growth rate decline (World bank, 2023).
The appreciation of the Ghanaian cedi against the United States dollar and the anticipated financial bailout by the IMF may have contributed to the current optimism reflected in the LMI index score of 67.1, which is the highest recorded since the Ghana LMI’s inception.
The current optimism also seems to reflect the increasing activity at the country’s major ports (Tema and Takoradi), which had experienced a decline in traffic beginning mid-year 2022 and into the early part of this year.[4] The decline had been attributed to increases in the general costs of doing business (mid-2022) and the reversal of the benchmark policy, as well as increases in import duties and the introduction of new taxes. Importers that sought alternative ways of doing business seem to be turning back to patronizing the ports. Import volumes moving through the ports are gradually creeping back up.
Inventory levels have grown by 10.7 points and currently stand at 61.2, up from last quarter’s 50.5. This rebound is a significant improvement from the previous quarter, when inventory levels fell below the threshold value of 43.2 in September 2022 (Q3). This rebound may be linked to growth in the retail and consumables sector due to marginal appreciation of the Ghanaian cedi against the United States dollar in early December 2022.
It is expected that inventory levels will continue to increase as consumer spending continues to grow through the second and third quarters. Large retailers are expected to bring in new inventory to meet growing demand for goods in the second and third quarters. The reduction in inventory cost recorded (from 85.1 in December 2022 to 80.6 in March 2023) means that companies can purchase more goods with the same amount of money. Since the inception of the LMI, inventory costs have always been in the 80s and 90s with an all-time high value of 94.1 in the third quarter of 2022.
It is expected that inventory levels will continue to rise while inventory costs continue their downward trend over the next two quarters. A continued decline in inventory costs would be a relief to consumers and companies at every level of the supply chain. It remains to be seen, however, if inventory costs will ever fall below 70 (currently stands at 80.6), which is the cut off point for significant rates of growth.
Warehousing capacity has slightly increased to 52 from last quarter’s 50.5 (+1.5). Rental rates have been quite consistent. However, the slight improvement in the economy may be pushing demand for warehousing capacity. The increase in warehousing capacity has led to a decrease in warehousing prices, from 89.7 in the last quarter of 2022 to 81.2 in this quarter (-8.5). This number is still in the realm of significant expansion. Except for the first quarter of 2022, which had a value of 78.4, warehouse prices have always been in the 80s. The other warehousing metric that is showing growth is warehouse utilization, which climbed from 52.1 to 63.8 (+11.7). Boosted by growing inventory levels, managers have been able to make better use of available inventory space, leading to an improvement in utilization.
Transportation metrics also showed a healthy growth, with a reduction in the transportation price index (from 95.2 to 91.9). Transportation prices peaked in September 2022 (Q3) with a value of 97.1. However, in late December 2022 and early January 2023, global fuel prices stabilized, which led to a 15.3% reduction in local public transportation fares.[5] Major logistics companies in Ghana such as
DHL, UPS and TPL are also benefiting from the reduced fuel prices as they begin to see increasing volumes of transport services. This is consistent with other metrics that suggest that consumers are beginning to increase spending on direct retailing activities.
Transportation capacity index for the quarter declined from 69.2 to 60.3 (-8.9) due to an increase in inventory levels, which has led to the improvement we see in transportation utilization from 59 to 69.7 (+10.7).
Aggregate Logistics Costs
To generate an overview of logistics costs, the three-cost metrics (i.e. inventory costs, warehousing and transportation prices) were aggregated. Figure 3 shows the aggregate logistics costs for Ghana represented by the chart on the right with the blue line (movement in aggregate logistics costs from March 2022 – March 2023). The chart on the left of Figure 3 shows the aggregate logistics costs for the USA, represented by the green line (movement in aggregate logistics costs from March 2020 – March 2023). The vertical axis of the chart ranges from 0 – 300 because the scores of the three metrics are aggregated, with 150 representing the break-even point. The chart reveals that, in March 2023, the aggregate costs in the USA were down to 168.1 while that of Ghana were down to 254. In simple terms, the charts suggest that the cost of logistics activities in Ghana is higher than in the USA. Being a developing economy, Ghana’s infrastructure challenges, bureaucracy, currency depreciation and high cost of doing business have contributed to its high aggregate logistics cost. Despite the high costs, the 254 value for the first quarter of 2023 is the lowest reading so far for Ghana in the history of the Ghana LMI. In previous quarters, the aggregate cost had crested at 275.8, in September 2022 (Q3), while inflation in Ghana was at its highest (54.1%) in December before declining to 45% in early 2023.

FIRST QUARTER 2023 OBSERVATIONS
Overall LMI
The overall LMI metric for Ghana has increased for a second consecutive quarter (up by 3.1) to a reading of 67.1 in March 2023 from December 2022’s reading of 64.0. This also happens to be the highest reading of the Ghana LMI so far. The rise has been propelled by improvements in inventory levels and the decline in the three-cost metrics of transportation, warehousing and inventory.
In general, there were significant drops in the areas of inventory cost (-4.5), warehouse prices (-8.5), transportation prices (-3.3) and transportation capacity (-8.9). These drops in the cost-related metrics played a major role in expanding logistics activities. Metrics that showed growth were inventory levels (+10.7), warehouse capacity (+1.5), warehouse utilization (+11.7) and transportation utilization (+10.7). All the LMI metrics for Ghana have registered values above the threshold of 50%.
As of the first quarter of 2023, the LMI metric for Ghana is showing significant growth. This growth is influenced by improved consumer spending and the expectation that the ongoing negotiation with the International Monetary Fund (IMF) will be concluded in time to provide an economic stimulus for the Ghanaian economy. There is also a gradual improvement in inflation and a marginal appreciation of the cedi against major currencies.
The index scores for each of the eight components of the Logistics Managers Index, as well as the overall LMI score for the first quarter of 2023 are presented in Table 1.0 (page 7). For the fifth consecutive time, transportation prices dominated the readings as the metric with the highest value, recording a score of 91.9. That metric was followed by warehousing prices (at 81.2) and inventory cost (at 80.6). These three metrics have always had the highest values since the inception of the Ghana LMI, with transportation price readings always being in the 90s.
Supply chain managers predict that the growth observed in the logistics sector will continue to rise to a future LMI value of 69.3 (an improvement on last quarter’s prediction of 64.8). The results from the next survey (second quarter 2023) will show whether these predictions hold. However, expectations are high with the impending $3 billion IMF bailout and expected World Bank $1 billion credit injection into the Ghanaian economy.
Table 1.0: LMI Values for Ghana for the First Quarter 2023 and Fourth Quarter 2022
| LOGISTICS AT A GLANCE – Q1 2023 | |||||
| Index | March 2023 Index | Dec 2022 Index | Quarter-Over-Quarter Change | Projected Direction | Rate of Change |
| LMI® | 67.1 | 64 | 3.1 | Growing | Increasing |
| Inventory Levels | 61.2 | 50.5 | 10.7 | Growing | Increasing |
| Inventory Costs | 80.6 | 85.1 | -4.5 | Growing | Decreasing |
| Warehousing Capacity | 52 | 50.5 | 1.5 | Growing | Increasing |
| Warehousing Utilization | 63.8 | 52.1 | 11.7 | Growing | Increasing |
| Warehousing Prices | 81.2 | 89.7 | -8.5 | Growing | Decreasing |
| Transportation Capacity | 60.3 | 69.2 | -8.9 | Growing | Decreasing |
| Transportation Utilization | 69.7 | 59 | 10.7 | Growing | Increasing |
| Transportation Prices | 91.9 | 95.2 | -3.3 | Growing | Decreasing |
Historic Logistics Managers’ Index Scores
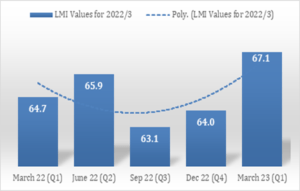
The reading for this quarter along with readings from the last four quarters of the LMI are presented in table 2.0 below:
Table 2.0: Historic Logistics Managers’ Index Scores
| Quarter | LMI Values | All-time Average – 64.96
High – 67.1
Low – 63.1
Std Dev – 1.57 |
| Q1 – 2023 | 67.1 | |
| Q4 – 2022 | 64.0 | |
| Q3 – 2022 | 63.1 | |
| Q2 – 2022 | 65.9 | |
| Q1 – 2022 | 64.7 |
UPSTREAM VS DOWNSTREAM ACTIVITIES
In general, there is not much difference in the observations made for firms in the downstream (reflected by the red bars in Fig. 5.0) and those in the upstream (blue bars). Even though downstream firms reported slightly elevated levels of transport and inventory cost, warehousing price was at par. Upstream firms seemed to have slightly elevated levels of utilization (transportation and warehousing).
The implication is that B2B firms are more efficient with transport and warehouse utilization because they deal with large volumes. B2C firms are paying slightly more for transportation and inventory, due to their inability to negotiate lower rates because of the low volumes they carry.

| Upstream vs. Downstream Values – Q1 2023 | ||||
| Index | Upstream Values | Downstream Values | Delta | Significant? |
| LMI® | 66.48 | 67.41 | 0.93 | No |
| Inventory Levels | 62.77 | 62.03 | 0.74 | No |
| Inventory Costs | 72.83 | 82.08 | 9.25 | Marginal |
| Warehousing Capacity | 50 | 52.22 | 2.22 | No |
| Warehousing Utilization | 64.89 | 63.71 | 1.18 | No |
| Warehousing Prices | 81.32 | 81.29 | 0.03 | No |
| Transportation Capacity | 62.11 | 59.69 | 2.42 | No |
| Transportation Utilization | 72.63 | 69.16 | 3.47 | No |
| Transportation Prices | 89.47 | 92.97 | 3.5 | No |
PREDICTIONS
The predictions made in March (Figure 6.0) are similar to what we saw in December but slightly more optimistic. The current growth boost is expected to continue over the next 12 months, resulting in an expansion of the LMI to 69.3, up by +4.5 from December’s prediction of 64.8.
Like last quarter, logistics managers expect that inventories will continue building up and expand to 75.6 in the next two or three quarters. They also anticipate that inventory cost will continue to experience a downward trend to 75.2 while warehousing capacity continues to open up. They predict warehousing prices to keep coming down as utilization improves.
Because Ghana’s economy is import oriented, all three-cost metrics are influenced by foreign exchange rates (predominantly the US dollar). As a result, inventory costs correlate to a large extent with the appreciation and depreciation of the cedi against the dollar. The first quarter of 2023 has seen the cedi appreciate, making respondents optimistic about the falling prices of inventory.
Warehouse prices are more stable, even though priced in dollars, because of long-term contracts that fix rental rates. Nevertheless, warehousing prices are predicted to be in the 80s, which is not much relief to warehousing tenants and consumers. Transportation prices are predicted to continue contracting over the next 12 months, as respondents grow increasingly optimistic about a reduction in inflation and fuel prices and an increase in volumes.
Table 4.0 also shows the current and predicted values for all eight metrics from this quarter’s survey (March 2023). To generate the predicted future LMI values for Ghana, we asked respondents to predict movements in the individual metrics for the next 12 months. Results show high optimism about the potential for increased logistics activities and reduced costs in the coming year. Figure 6.0 shows the predicted values, while figure 7.0 compares both current and predicted values.
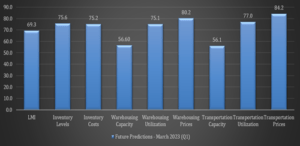
| LOGISTICS AT A GLANCE – Current and Predicted Values (Q1 2023) | ||
| Index | March 2023 – Current | March 2023 – Predicted |
| LMI | 67.1 | 69.3 |
| Inventory Levels | 61.2 | 75.6 |
| Inventory Costs | 80.6 | 75.2 |
| Warehousing Capacity | 52.0 | 56.6 |
| Warehousing Utilization | 63.8 | 75.1 |
| Warehousing Prices | 81.5 | 80.2 |
| Transportation Capacity | 60.3 | 56.1 |
| Transportation Utilization | 69.9 | 77.0 |
| Transportation Prices | 91.9 | 84.2 |
ELECTRONIC PAYMENT SYSTEMS INDEX
The Electronic Payment Systems Index (EPI) was introduced in the second quarter of 2022 and has become a major feature of the LMI surveys. It gauges the views of respondents on the usage of electronic payment systems when transacting business with suppliers and customers. These electronic payment systems and methods make purchasing and procurement easier, more cost-effective and time saving.
According to the recent World Bank Logistics Performance Indicator Report (2023), “end-to-end supply chain digitization, especially in emerging economies, is allowing developed countries to shorten port delays by up to 70% compared to those in developing countries.” E-payment systems support supply chain digitization and in Ghana Mobile Money Interoperability services has provided financial inclusion to businesses and consumers allowing for seamless electronic financial transactions. The logistics industry has benefited from this project, which has been championed by the vice president, Dr. Mahamadu Bawumia[6].
Like the LMI, the EPI has a threshold of 50% and is developed as a diffusion index. The EPI for the first quarter of 2023 registered a value of 67.0 (an increase of 4.1 from last quarter’s value of 62.9) as indicated in figure 8 and 9.

Respondents predicted that usage of electronic payment systems will grow to a value of 81.7 over the next 12 months (an increase of 6.3 from last quarter’s prediction of 75.4). The prevailing economic situation with high inflation and poor exchange rates has affected these predictions in the past. Nevertheless, usage of electronic payment systems has grown steadily, albeit slowly, with a potential to pick up again as economic situations in the country improve.
About This Report
Data and Methodology
Researchers at the Centre for Applied Research and Innovation in Supply Chain – Africa (CARISCA) issued this report today. The Logistics Managers Index (LMI) is a new tool developed by CARISCA, based at Kwame Nkrumah University of Science and Technology, for Ghanaian businesses and policymakers. The LMI reports are based on quarterly surveys conducted with industry leaders in Ghana. The study is led by Emmanuel Kweku Quansah (Ph.D.), Nathaniel Boso (Ph.D.) and Abdul Samed Muntaka (Ph.D.) of KNUST.
The calculated LMI for Ghana, along with the accompanying analysis of its components, provides useful insights for the government of Ghana, business decision-makers, market analysts and investors, as it offers a predictive indication of overall economic activity in the country.
The LMI report is made available quarterly at https://carisca.knust.edu.gh/LMI. Senior supply chain (including operations) managers of businesses in Ghana are invited to participate in the quarterly LMI surveys by visiting: https://www.surveymonkey.com/r/Q2-23-LMI
The LMI measures the growth or decline of Ghana’s logistics industry along three components: inventory, warehousing and transportation activities. The LMI for Ghana study utilizes eight metrics across the three components to capture Ghana’s logistics activities. The index measures combinations of inventory, warehouse and transportation activities and tracks the relationship between these variables to make inferences about their effects on the broader Ghanaian economy.
An index score is calculated for each of the eight components, and an overall index score (i.e., an LMI value) is then evaluated as a composite of these components. This LMI value is expressed as a percentage with a mid-value/threshold of 50%. An LMI value above 50% indicates a growing logistics industry, while a value less than 50% indicates a contracting logistics industry.
This approach is an effective and a reliable way to identify prevailing trends in logistics activities. Due to its predictive nature, the LMI is also a useful tool for forecasting future trends in a modern economy (Rogers et al., 2018).
Data for the Logistics Managers Index for Ghana are collected in quarterly surveys. Respondents for the study include senior logistics, supply chain and procurement executives and managers in the formal sector of the Ghanaian economy. Senior executives and managers are most likely to have macro-level information on inventory, warehousing and transportation trends in their organizations.
Data are also collected from professional members of the Chartered Institute of Logistics and Transport (CILT) and the Chartered Institute of Procurement and Supply (CIPS). Members of these professional bodies in Ghana tend to hold senior management positions in their organizations.
To ensure that the LMI value for Ghana is a true reflection of logistics activities in the Ghanaian economy, the respondents for this study were required to be working for organizations that operate in Ghana. Multiple industries were represented in the respondent pool: automobile and parts, telecommunications, shipping and transport, agriculture and agriculture business, manufacturing, mining, pharmaceuticals, industrial services, oil and gas/petroleum, and machinery and equipment.
A total of 433 valid responses were used for the Q1 2023 report.
The Diffusion Index
The LMI for Ghana is calculated using the diffusion index. The diffusion index is used to calculate other widely accepted indexes, such as the Purchasing Managers Index (PMI) and the USA LMI. This index gives an indication of whether the metric being evaluated is contracting or growing. Values below 50.0 suggest a contraction, while values above 50.0 suggest growth in an activity (Getz and Ulmer, 1990). Thus, LMI values below 50.0 would be suggestive of contraction whereas values above 50.0 would suggest expansion in logistics activities.
Diffusion indexes are used to measure how widely a variable is spread across a group. The Institute for Supply Management (ISM) has been using the diffusion index to compute the Purchasing Managers Index since 1948. In keeping with the approach by Rogers, et al. (2018) and ISM, we computed the diffusion index as follows:
| DI: 0.0 * PD + 0.5 * PU + 1.0 * PI |
Where PD = % of respondents saying a category is declining, PU = % of respondents saying a category is unchanged, and PI = % of respondents saying a category is increasing.
Logistics Managers Index for Ghana – Request for Permissions
Requests for permission to reproduce or distribute the contents of the Logistics Managers Index for Ghana should be sent (in writing) to Professor Nathaniel Boso, CARISCA-KNUST Secretariat, PMB, KNUST School of Business, Kumasi, Ghana. Alternatively, requests for permission can be made by sending an email to [email protected].
The authors of the Logistics Managers Index for Ghana report shall not have any liability, duty or obligation for or relating to the content of the Logistics Managers Index for Ghana or other information contained herein, any errors, inaccuracies, omissions or delays in providing any Logistics Managers Index content, or for any actions taken in reliance thereon. Under no circumstances shall the authors of the Logistics Managers Index for Ghana be liable for any special, incidental or consequential damages arising out of the use of the Logistics Managers Index for Ghana.
The Logistics Managers Index (LMI) for Ghana makes no representation other than that stated in this release regarding the individual company data-collection procedures. The data should be compared to all other economic data sources when used in decision-making.


