")
Most societies throughout the world have been plagued with epidemics and pandemics at different time periods since time immemorial. Adverse effects of epidemic and pandemic outbreaks on human societies could be categorised into social, economic and educational effects. The underlying objective of this research was to examine the extent of influence that pandemics such as COVID-19 could have on the successful implementation of intended annual academic programmes and activities in various countries and territories across the globe. To achieve the foregoing objective, the research sought to test causal relationship between total learners’ population and total national population. The latter helped to measure the extent to which academic institutions could contribute to the spread of the pandemic, controlling for other internal and external environmental factors.
Methodology
The quantitative approach to scientific inquiry formed the basis of the research. Specifically, a cross-sectional design, an example of survey design, was adapted and used in the study. This design allowed the researchers to gather relevant research data over a specific period of time (Ashley, Takyi & Obeng, 2016; Creswell, 2009; Frankfort-Nachmias and Nachmias, 2008).
Data required for the conduct of the current research were obtained mainly from secondary sources. These included textbooks, peer-reviewed articles published in journals, research papers, newspaper publications; Google Search Engine including worldometers.info, africanews.com, ghanahealthservice.org, who.int and weforum.org; and electronic databases of international bodies such as the United Nations Education, Scientific and Cultural Organisation (UNESCO), among other significant sources.
Respective data on pre-primary through secondary levels, and tertiary level for one hundred and eight (108) countries across the globe; population data for each of these 108 countries; and available data on COVID-19 were used in the study.
Analytical Tools
Descriptive statistics and regression models were used to describe the research variables; and to evaluate their behaviour over the stated time frame on global education. Measures such as standard deviation and range were employed to describe the extent of dispersion about the central tendency (Ashley et al., 2016; Creswell, 2009; Frankfort-Nachmias & Nachmias, 2008). These measures were used to describe trends in global education drawing on data for the 108 countries; and data for COVID-19 during the research period.
Research Variables
The independent research variable was total learners’ population while the dependent research variable was the relative effect of total learners’ population on total national population.
Regression Model
Regression statistical model was adapted to measure the effect and level of interaction of total learners’ population on total national population over the research period. Specifically, the research sought to measure the extent to which respective global governments’ decisions to re-open schools; while effective medication had not been discovered could negatively impact spread of COVID-19 among their respective total national populations, especially when most school children were found to be asymptomatic; and transmission of the virus from asymptomatic patients to others was prevalent and severe.
The research sought to measure the extent to which in a given academic year, pandemics such as COVID-19 could significantly impact on successful completion of planned educational programmes and activities in countries and territories across the globe, controlling for other internal and external environmental factors such as Tsunamis, hurricanes, earthquakes and bush fires. The Microsoft Excel analytical software was adapted and used in the research. Diagrams and tables were derived from Microsoft Excel to explain the research data.
Hypotheses
The study tested causal relationship between total learners’ population and total national population values using the following null and research or alternative hypotheses:
Ho:µ1 = µ2; this implies total learners’ population has no strong effect on total national population
H1:µ1 ≠ µ2; this implies total learners’ population has strong effect on total national population.
Findings from the research and related discussions are presented in the ensuing section. The section presents findings based on review of existing and related literature on the phenomenon; and based on empirical analysis of sampled data. The discussions are categorised into sub-themes and presented as follows.
Descriptive Statistics
A statistical description of the total learners’ population for each of the 108 countries included in the analysis is presented in Figure 5. Analysis in this section drew on the data in Table 2, column 2. The figure indicates the respective sample variance (7.94325) and skewness (8.174115) for the distribution. Skewness explains the distortion or asymmetry of the random variable around the mean in the distribution. Statistical data in the figure depict respective Kurtosis and standard error values of 75.748975 and 2711984.136. The extent to which the coefficients are significantly different from zero is explained by the standard error value. The minimum value in the figure is 9182. This represents total learners’ population value for Cayman Islands (9,182 total learners).
Figure 5: Total Learners’ Population for Selected Economies
| Mean | 9366541.944 |
| Standard Error | 2711984.136 |
| Median | 2428342 |
| Mode | 396782 |
| Standard Deviation | 28183765.88 |
| Sample Variance | 7.94325E+14 |
| Kurtosis | 75.74897528 |
| Skewness | 8.174115111 |
| Range | 275426903 |
| Minimum | 9182 |
| Maximum | 275436085 |
| Sum | 1011586530 |
| Count | 108 |
| Largest(1) | 275436085 |
| Smallest(1) | 9182 |
| Mean | 3540.35 |
The maximum value (275436085) is representative of the total learners’ population for China, including Hong Kong and Macao (275,436,085 total learners). The range explains the difference between the maximum and minimum values for the distribution. Value for the range (275426903) explains the substantial difference (275,426,903) between the respective total learners’ population values for China, including Hong Kong and Macao (275,436,085) and Cayman Islands (9,182) during the research period. The value for sum (1,011,586,530) in Figure 5 depicts the total number of learners included in the analysis. This value is significant relative to the estimated total number of learners across the globe.
It is worth reiterating a significant proportion of the total global population is contributed by the 108 countries included in the analysis. As a result, another descriptive statistical test was conducted to ascertain the magnitude of the total population values for the sampled economies during the period. The population data in Table 2, column 3 were used for the analysis in this section. Figure 6 presents a statistical description for measures of central tendency such as the mean, median, and mode; and measures of dispersion such as the range, minimum, maximum and standard deviation (Ashley et al.; Frankfort-Nachmias and Nachmias, 2008) for the total population values used in the research.
Figure 6: Total Populations for Selected Economies
| Mean | 44009699.73 |
| Standard Error | 14043522.13 |
| Median | 10566017.5 |
| Mode | #N/A |
| Standard Deviation | 145944563.1 |
| Sample Variance | 2.12998E+16 |
| Kurtosis | 81.68638723 |
| Skewness | 8.594030212 |
| Range | 1447404370 |
| Minimum | 65722 |
| Maximum | 1447470092 |
| Sum | 4753047571 |
| Count | 108 |
| Largest(1) | 1447470092 |
| Smallest(1) | 65722 |
| Mean | 50.80553333 |
Figure 6 presents the respective highest (1,447,470,092) and lowest (65,722) total national population values recorded during the research period. The highest value represents the total populations for China, including Hong Kong and Macao while the lowest reflects the total population value for Cayman Islands. The range of total population values during the period is 1447404370 (1,447,404,370). This represents the difference between the highest (1,447,470,092) and lowest (65,722) total population values recorded during the period.
Results in Figure 6 depict respective mean and median of 50.8055and 10566017.5; and standard deviation of 145944563.1. These tell us the extent to which the observations were dispersed around the central tendency. The mode explains the variable with the highest frequency or number of occurrence in the data. The figure shows no absolute value (#N/A) for the mode. This implies no total national population value was repeated. That is, there were no two or more countries with the same total national population values during the period. Coincidentally, a significant number if not all of the 108 countries included in the analysis were greatly affected by the COVID-19 outbreak. This raised concerns about the possibility of meeting universal targets for educational programmes and activities during 2020.
Results
The objective of this research was to test the underlying hypothesis. That is, measure the extent to which a given total learners’ population significantly influences total national population value. Statistics in column 2, Table 2, depict the respective total learners’ population values for the 108 economies sampled for the research. Data in the table show countries such as China, including Hong Kong and Macao (275,436,085), Indonesia (68,265,787), United States (55,100,000), Pakistan (46,803,407) and Bangladesh (39,936,843) have fairly large total learners’ population values affected by COVID-19.
Column 3 in the table presents the respective total national population values for the sampled population. Data used in this section were obtained from the databases of UNESCO and Worldometer. Causal relationship between the independent variable (total learners’ population) and the dependent variable (total national population) was tested using regression analytical tools. Results from the analysis are presented in the following section.
Table 2: Data on Total Learners and Total Population for Selected Global Economies
| COUNTRY | TOTAL LEARNERS’ POPULATION | TOTAL NATIONAL POPULATION |
| Afghanistan | 9,979,405 | 38,928,346 |
| Albania | 652,592 | 2,877,797 |
| Algeria | 10,236,182 | 43,851,044 |
| Argentina | 14,202,149 | 45,195,774 |
| Armenia | 540,503 | 2,963,243 |
| Austria | 1,708,540 | 9,006,398 |
| Azerbaijan | 1,983,999 | 10,139,177 |
| Bahrain | 292,429 | 1,701,575 |
| Bangladesh | 39,936,843 | 164,689,383 |
| Belgium | 2,984,458 | 11,589,623 |
| Bolivia* | 2,612,837 | 11,673,021 |
| Bosnia and Herzegovina | 523,241 | 3,280,819 |
| Bulgaria | 1,224,406 | 6,948,445 |
| Burkina Faso | 4,686,723 | 20,903,273 |
| Cambodia | 3,522,262 | 16,718,965 |
| Cayman Islands* | 9,182 | 65,722 |
| Chile | 4,891,092 | 19,116,201 |
| China** | 275,436,085 | 1,447,470,092 |
| Colombia | 11,532,903 | 50,882,891 |
| Costa Rica | 1,317,482 | 5,094,118 |
| Côte d’Ivoire | 6,338,832 | 26,378,274 |
| Croatia | 787,188 | 4,105,267 |
| Cyprus | 180,617 | 1,207,359 |
| Czech Republic | 2,068,763 | 10,708,981 |
| D. P. Republic of Korea | 4,755,570 | 51,269,185 |
| Denmark | 1,497,943 | 5,792,202 |
| Ecuador | 4,783,225 | 17,643,054 |
| Egypt | 26,071,893 | 102,334,404 |
| El Salvador | 1,604,845 | 6,486,205 |
| Equatorial Guinea* | 160,019 | 1,402,985 |
| Estonia | 272,781 | 1,326,535 |
| Ethiopia | 24,686,497 | 114,963,588 |
| Fiji | 453,894 | 896,445 |
| France | 15,462,340 | 65,273,511 |
| Gabon | 478,438 | 2,225,734 |
| Georgia | 883,677 | 3,989,167 |
| Germany | 15,382,695 | 83,783,942 |
| Ghana | 9,696,756 | 31,072,940 |
| Greece | 2,204,532 | 10,423,054 |
| Grenada | 35,288 | 112,523 |
| Guatemala | 4,559,618 | 17,915,568 |
| Honduras | 2,285,249 | 9,904,607 |
| Hungary | 1,791,758 | 9,660,351 |
| Iceland | 98,224 | 341,243 |
| Indonesia | 68,265,787 | 273,523,615 |
| Iran | 18,635,825 | 83,992,949 |
| Iraq | 7,435,696 | 40,222,493 |
| Ireland | 1,319,122 | 4,937,786 |
| Israel | 2,481,467 | 8,655,535 |
| Italy | 10,876,792 | 60,461,826 |
| Jamaica | 627,156 | 2,961,167 |
| Japan* | 16,496,928 | 126,476,461 |
| Jordan | 2,372,736 | 10,203,134 |
| Kazakhstan | 5,060,284 | 18,776,707 |
| Kenya | 14,314,351 | 53,771,296 |
| Kuwait | 749,324 | 4,270,571 |
| Kyrgyzstan | 1,661,618 | 6,524,195 |
| Latvia | 396,782 | 1,886,198 |
| Lebanon | 1,363,393 | 6,825,445 |
| Lesotho | 396,782 | 2,142,249 |
| Libya | 1,885,226 | 6,871,292 |
| Lithuania | 586,120 | 2,722,289 |
| Luxembourg | 109,897 | 625,978 |
| Malaysia | 7,962,033 | 32,365,999 |
| Mauritania | 947,589 | 4,649,658 |
| Mexico | 37,589,611 | 128,932,753 |
| Mongolia | 1,026,210 | 3,278,290 |
| Montenegro | 135,689 | 628,066 |
| Morocco | 8,943,156 | 36,910,560 |
| Namibia | 745,566 | 2,540,905 |
| Netherlands | 4,211,999 | 17,134,872 |
| North Macedonia | 359,623 | 2,083,374 |
| Norway | 1,357,563 | 5,421,241 |
| Pakistan | 46,803,407 | 220,892,340 |
| Palestine | 1,626,357 | 5,101,414 |
| Panama | 998,348 | 4,314,767 |
| Paraguay | 1,744,889 | 7,132,538 |
| Peru | 9,911,513 | 32,971,854 |
| Poland | 7,553,488 | 37,846,611 |
| Portugal | 2,375,217 | 10,196,709 |
| Qatar | 343,524 | 2,881,053 |
| Republic of Korea | 10,181,358 | 25,778,816 |
| Republic of Moldova | 586,158 | 4,033,963 |
| Romania | 2,951,879 | 19,237,691 |
| Rwanda | 3,464,409 | 12,952,218 |
| Saint Lucia | 33,162 | 183,627 |
| Saudi Arabia | 8,410,264 | 34,813,871 |
| Senegal | 3,660,526 | 16,743,927 |
| Serbia | 1,220,968 | 8,737,371 |
| Slovakia | 988,103 | 5,459,642 |
| Slovenia | 412,224 | 2,078,938 |
| South Africa | 14,612,546 | 59,308,690 |
| Spain | 9,706,284 | 46,754,778 |
| Sri Lanka | 5,218,372 | 21,413,249 |
| Sudan | 8,824,167 | 43,849,260 |
| Switzerland | 1,589,837 | 8,654,622 |
| Syrian Arab Republic | 4,188,528 | 17,500,658 |
| Thailand | 15,401,441 | 69,799,978 |
| Trinidad and Tobago | 277,190 | 1,399,488 |
| Tunisia | 2,751,424 | 11,818,619 |
| Turkey | 24,901,925 | 84,339,067 |
| Ukraine | 6,785,004 | 43,733,762 |
| United Arab Emirates | 1,362,359 | 9,890,402 |
| United States*** | 55,100,000 | 331,002,651 |
| Uzbekistan | 7,474,117 | 33,469,203 |
| Venezuela* | 6,866,822 | 28,435,940 |
| Yemen | 6,119,823 | 29,825,964 |
| Zambia | 4,012,617 | 18,383,955 |
Data Sources: UNESCO (2020) & Worldometer (2020)
*Data exclude tertiary level learners
**Data include Hong Kong and Macao
***Data exclude breakdowns
Graphical presentation of the data in Table 2 is outlined in Figure 7. Stated in different terms, data on respective total learners’ populations and total national populations for the sampled economies are presented in Figure 7. Data distribution in the figure affirm dominance of China, including Hong Kong and Macao (275,436,085) and Indonesia (68,265,787) in the total number of learning populations adversely impacted by the outbreak of COVID-19. Nearly 72.5% (about 55.1 million learners) of the estimated total learning population in the United States (76 million total learners) were severely impacted by the predatory COVID-19 pandemic during 2020. However, the respective learning populations impacted in Zambia (4,012,617 learners) and Switzerland (1,589,837 learners) were equivalent to 21.83% and 18.37% of their respective national populations: Zambia (18,383,955 people) and Switzerland (8,654,622 people).
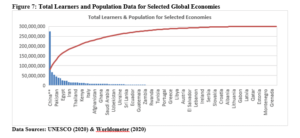
The total number of learners affected in the United States (55.1 million learners) was nearly 8.3 million more than the affected learning population in Pakistan (46.8 million learners); and about 17.5 million more than the estimated total learning population negatively impacted in Mexico (37.6 million) during the pandemic period. The computations suggest the affected learning population (37,589,611 learners) constituted nearly 29.15% of the total Mexican population (128,932,753); which is equivalent to 38.95% of the United States’ total population (331,002,651).
In Indonesia, about 24.96% of the total population (273,523,615) is learners who were affected by the outbreak of COVID-19; implying about 29% of the population had the potential of spreading the virus throughout the country, if nationwide school closures had not been adapted and implemented as a timely non-pharmaceutical intervention tool. Similarly, the estimated total learners’ population affected (14,612,546 learners) suggests, about 24.64% of the total population in South Africa (59,308,690 people) served as potential conduits for spread of the Coronavirus across the length and breadth of the country. Lo and behold, the second wave of COVID-19 and its attendant increase in reported cases and deaths in South Africa amply demonstrated how precipitated school re-openings resulted in overwhelming surge in social and economic costs to the country.
Author’s Note
The above write-up was extracted from an earlier publication titled: “Impact of the Coronavirus Pandemic on Global Education” by Ashley (2022) in the International Journal of Business and Management.


