
While looking for an appropriate response during the height of the unprecedented climate change events, my attention was drawn to an article published on 13th of October, 2021 by the Paris-based International Energy Agency, which is responsible for energy affairs for the OECD countries.
The very first paragraph of the article reads: “A new energy economy is emerging around the world as solar, wind, electric vehicles and other low-carbon technologies flourish. But as the pivotal moment of COP26 approaches, the IEA’s new World Energy Outlook makes it clear that this clean energy progress is still far too slow to put global emissions into sustained decline toward net zero, highlighting the need for an unmistakeable signal of ambition and action from governments in Glasgow.”
Let’s take a look at 2 other statements:, (1) “The WEO-2021, ……shows that even as deployments of solar and wind go from strength to strength, the world’s consumption of coal is growing strongly this year”, and (2) “The world’s hugely encouraging clean energy momentum is running up against the stubborn incumbency of fossil fuels in our energy systems.”
Confirmation
The observations made by the IEA in the WEO-2021 validate my conviction that the installation of solar power (SP) and wind power (WP), the undisputed fastest growing technologies, have been deployed very remarkably for decades, but with little to no show. That is due to their low capacity factors (CFs), which depend on their relatively low energy intensity, and their intermittency in electricity generation. Since SP’s availability to produce power is only about 8-10 hours in a day, it has the least CF, as shown in Table 1: CFs of 12.5, 14.0, 14.3, 11.2 and 16.2 percent for China, the USA, Japan, Germany and India respectively, the top 5 SP-electricity producing countries.
Table 1 Solar power production in the top five countries
| Countries
|
Installed Capacity | Generated Electricity | Capacity Factor |
| China | 205.0 GW | 223.8 TWh | 12.5% |
| USA | 76.0 GW | 93.1 TWh | 14.0% |
| Japan | 64.2 GW | 79.1 TWh | 14.3% |
| Germany | 49.2 GW. | 47.5 TWh | 11.0% |
| India | 38.0 GW | 54.0 TWh | 16.2% |
With the help of Table 2, we can compare and contrast the data for installed capacity and generated electricity for better appreciation of CFs. All the data for the USA in Table 2, including CFs were taken from Wikipedia. CFs in Table 2 for Germany and China, were calculated by the author. The remaining data for Germany, were pulled from a German energy publication, ‘The Clean Energy Wire’, and those for China were extracted from Wikipedia.
Table 2 Comparing capacity factors for SP, WP and NP
| Installed Capacity | Generated Electricity | Capacity Factor | |
| USA, SP | 48.05 GW | 88.20 TWh | 21.2% |
| USA, WP | 118.38 “ | 337.94 “ | 32.6% |
| USA, NP | 96.5 “ | 789.88 “ | 93.4% |
| Germany, SP | 53.10 “ | 50.4 “ | 10.8% |
| Germany, WP | 54.5 “ | 105.3 “ | 22.1% |
| Germany, NP | 8.1 “ | 64.3 “ | 90.6% |
| China, SP | 204.18 “ | 224.0 “ | 12.5% |
| China, WP | 209.15 “ | 405.3 “ | 22.1% |
| China, NP | 48.74 “ | 348.7 “ | 81.7% |
It is clear from Table 2 that nuclear power (NP) with very high CF generates electricity more abundantly than any other option, hence, NP generates electricity that is affordable. Note that WP and SP have very low CFs, which is why they produce relatively small amounts of electricity. Since WP and SP produce electricity intermittently, their produced electricity is not dispatchable, or simply put, not reliable for the grid. To make intermittent electricity useful, it is backed by dispatchable electricity from sources such as natural gas and, more frequently, coal. That is why the deployments of WP and SP are moving in tandem with the world’s consumption of coal, as stated in the IEA’s WEO-2021 report.
Actually, a better way to utilise WP and SP produced electricity is to store it and use it when appropriate. However, energy storage devices, such as batteries, are costly, and affect the unit price. Furthermore, if the efficiency of the storage device is say 75-80 percent, it follows that the already meagre amount of electricity produced by WP or SP could be further reduced by 20-25 percent! These are the technical limitations that are often neglected by policy-makers who push for the adoption of WP and SP.
My great hope is that Egypt, that has opted to go nuclear and will host this year’s COP 27 meeting in Sharm El Sheikh in November, will make sure that NP is one of the prominent issues on the agenda, and provide some clarity around our exposure to nuclear radiation to address some of the fears linked with the adoption of NP.
The three type of nuclear radiation
To deepen our discussions on NP, let’s note that nuclear radiation is in three distinctive forms, known as alpha, beta and gamma radiation.
Alpha particles are the heaviest, and they are electrically positive. They can travel only about 2cm in air, and they are readily stopped by a sheet of paper. However they have the highest ionisation power, and so they can cause the worst damage when they are ingested or inhaled into our bodies. Alpha particles are emitted by radioisotopes of heavy elements.
Beta particles are fast moving electrons emitted by radioisotopes, and they can be stopped by aluminium foil. The ionisation potential of beta radiation is low. On the other hand, gamma-rays are photons, which are electromagnetic energy waves. They have the greatest penetration power, and they are stopped by lead. Of the three mentioned radiations, gamma radiation has the least ionisation power.
Natural sources of radiation
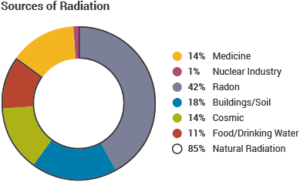
Natural sources of radiation in Fig.1a include (1) radon (discussed in detail subsequently), (2) food/water or human body, and (3) terrestrial. When radon decays it emits alpha particles – this provides the primary source of alpha radiation in the environment. Terrestrial radiation is mainly from gamma radiation which has low ionisation power. Hence, with low burden as shown in Fig 1b.
Fig 1b underscores the fact that uranium and thorium are ubiquitous, but they are not evenly distributed as their deposits differ very significantly, as demonstrated by radiation dose, dominated by radon, ranging from about 1.7mSv in the UK to about 7.8mSv in Finland.
Ubiquitous uranium and thorium
As shown in Figure 1a, the greater part of the background of ionising radiation we encounter in the environment is due to radon and thorium, the progenies from the ubiquitous uranium-238 (U-238) and thorium-232 (Th-232) respectively. Henceforth, our discussions will be based on only radon U-238 and Th-232. U-238 and Th-232are known as primordial radioisotopes with very long half-lives of 4.5 and 14.0 billion years respectively, and they have been decaying since the big bang. A couple of lighter radioisotopes, including potassium-40 (K-40) with a half-life 1.3 billion years, are also primordial.
As a matter of interest, U-238’s decay-chain goes through 14 stages, emitting alpha and beta radiations to reach the stable isotope of lead-206, Pb-206. In the fifth stage of this decay chain is radium-226 (Ra-226), with a half-life of 1620 years. It emits alpha particles, as it decays into radon-222 (Rn-222) with a half-life of only 3.82 days. Since Rn-222 is a noble or inert gas, it seeps freely, without any interactions through rocks, soil and water into the environment.
Rn-222 emits alpha particles as it decays into polonium-218 (Po-218), with a half-life of 3.05 minutes. This is followed by 4 other decays, emitting alpha, beta, beta and alpha radiations respectively, all within 1 hour. Radon is in the air we breathe, and when it is trapped, and decays in the lungs, it will be followed by 4 decays, as just explained.
NP’s share in background radiation is negligible
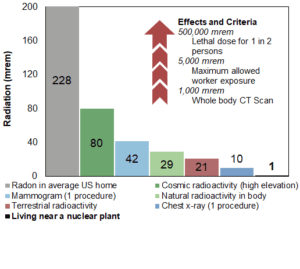
The bar-graph in Fig 2 depicts some samples of ‘Natural and man-made radiation exposure’ in the USA, which has the largest fleet of nuclear power reactors, which have been operating for over 60 years. Out of possible annual background radiation dose of about 300-350mrem an American receives, it is shown in Fig2 that the dose of radon at home accounts for 228mrem of the annual dose, as compared to only 1mrem from NP if the person lives close to a nuclear power plant.
Another relevant take away from Fig2 is the fact that all the measurements were per year, except 42 and 10mrem for mammogram and chest x-rays respectively, which were per procedure.
NOTE: mrem stands for millirem, while mSv stands for milliSievert. 1mSv=100mrem.
Healing powers of radon
The healing properties of hot springs were well known some 2000 years ago and the Romans, in particular, cherished them very much. In the recent past, after the discovery of the nucleus around 1915, which led to the development of nuclear physics, it became quite clear that hot-springs are radioactive. Hence, the healing powers of hot-springs, used as Wellness Spas were attributed to the combination of several minerals and radon in the water. One of such health centres is the well-known Gastein Healing Gallery in Austria, which is located in a cave inside a 2.5 km tunnel with high humidity, warmth and naturally elevated radon levels.
Many people who regularly and joyfully patronise spas are fully aware of their elevated levels of radiation. Obviously, the radiation levels at spas are at safe levels, and that explains why the patrons and the workers of spas, as well as medical officers in hospitals, are not burdened with lung-cancer or any other radiation-induced aliment.


