
By Kaunda ISMAIL
This article discusses key tools needed to master, in order to penetrate the data space. Such tools include SQL and NoSQL databases, Apache Airflow, Azure Data Factory, AWS S3, Google Cloud Storage, Azure Blob, Hadoop, Apache Spark, Python, Apache NiFi, Grafana, Power BI, etc.
There are also Python libraries for data science and machine learning engineering. This article will focus on 5 key tools that are relevant across key data roles.
MS Excel
Microsoft (MS) Excel remains one of the most fundamental tools in the data world, even for data engineers and data scientists.
While it is often viewed as a tool for basic analysis or spreadsheet management, Excel is also a crucial part of data engineering workflows, especially when working with smaller datasets (rows less than 1 million and a few dozen columns), performing quick transformations, or prototyping.
It provides powerful capabilities for data cleaning, organization, and analysis, and is an excellent starting point before moving onto more complex systems.
Practical Use Case of Excel
Assuming you’ve been tasked with managing and processing raw sales data for a retail company. The data is provided in multiple CSV files, each representing a different region or year. However, the data is inconsistent, with missing values, varying date formats, and inconsistent column headers.
In this situation, Excel can be used for:
- Data Cleaning: Use Excel’s built-in functions like IFERROR, TRIM, and TEXT to remove errors, standardize text formatting, and clean up missing or incorrect data.
- Consolidation: If the data is spread across multiple files or sheets, Excel’s power query can be used to load and consolidate data from various sources into one master file. The ability to filter, merge, and manipulate data quickly helps streamline the dataset for further processing.
- Analysing data
- Opening CSV format or XLS format files.
- Quick validation of output from systems. If you build a system as an Engineer to output CSV to stakeholders, you will most likely analyse sample output in Excel to make sure everything is fine before it goes to stakeholders.
Relevant excel features
The main features that will always come in handy are:
- Conditional formatting using highlighting rules or data bars, colour scales, and icon sets.
- Basic data validation: If you can set up rules to restrict data entry to a specific column in Excel, that is a great skill.
- The ability to create dropdowns/combobox is also helpful.
- Personally, the main feature I like in MS Excel is power query. Power query is the best ETL tool for someone entering the data space. It is used to Extract (E) data from different sources, Transform (T) the data into the format you want, and then Load (L) it to destination system or software. Everything can be automated so that you don’t have to repeat it when a new file comes in.
- Of course, the charts and graphs are also helpful. Learn them.
- Don’t forget pivoting. Learn it.
- The functions in Excel, especially IF, SUM, COUNT, VLOOKUP/XLOOKUP, and INDEX.
- Depending on your company, you may need to know macros too.
Structured Query Language
Structured Query Language (SQL) is used to interact with data. It is very important to master SQL. The rest of the learning is mainly tools/software (except Python which is also a language).
The good thing is, there are so many resources online to learn SQL. W3Schools is a good website I will recommend: www.w3schools.com/sql
Make sure you learn how to use all the keywords in this link:
www.w3schools.com/sql/sql_ref_keywords.asp
Also, learn all the formulas/functions here:
www.w3schools.com/sql/sql_ref_sqlserver.asp
Many of these formulas are also in Excel, so it is recommended that when you take a formula, use it in both Excel and SQL.
Finaly, before you start applying for a job, make sure you also know these things in SQL:
- Creating or altering tables, views, procedures and functions
- Common Table Expressions (CTEs)
- Joins (This is the same as VLookup in MS Excel or Venn Diagram in Mathematics)
Python
Python is very helpful, especially in the Data Engineering and Data Science space. If you don’t have programming experience, I recommend you to enter the data space via Data Analytics. That is the easiest route – it does not require Python. But for Data Engineering and Data Science, they do. The W3 platform has a good tutorial for python too.
Azure Data Factory (ADF)
Now, the good news is, Azure Data Factory (a drag-and-drop tool from Microsoft) is able to do a lot of what Python does, especially in the Analytic Engineering space, i.e., for ETL work.
ADF is the online version of the good old Microsoft SQL Server Integration Services (SSIS). So, if you know how to use SSIS, then you are automatically an ADF Data Engineer.
If you want to have a feel of how the ADF interface looks, see it below.
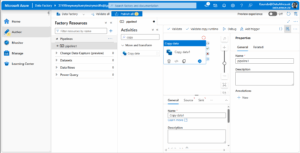
It is part of the Microsoft Azure platform, so you can create an account to experiment. When you create the account, Microsoft gives you $200 free credit that you can use to explore and experiment with the tools on the platform. When that is exhausted, you are charged pay-as-you-go.
Visualisation Tools
The two main industry visualisation tools are Power BI and Tableau.
Power BI is from Microsoft, and Tableau is from Salesforce. Learning either of the tools provides good job opportunity, and I don’t think you will be denied a job because you are using either of them.
Once you know Power BI, every experienced recruiter will know you need no more than a month to switch from one to the other. The two are just like Google Forms and Microsoft Forms, or Google Drive and Microsoft OneDrive.
I recommend Power BI because, Microsoft is behind it, and it integrates so well with many Microsoft tools. For large corporations, Power BI license is cheaper than Tableau.
That is all you need for a starter to enter the data market and grab your first role.
My subsequent articles will be on file formats and data types. Both look quite simple, but they are interesting topics you must understand before you start touching data.
Kaunda is a | Member, IIPGH
For comments, contact: [email protected], Facebook.com/KaundaAi


