")
Statistics – Descriptive Cont’d
Generally, a marginal increase in supply relative to high demand is likely to impel upward movement of the unit price of bitcoin in the global digital currency markets. It was therefore imperative to measure and assess the price movement of bitcoin over the research period. A summary of statistical distribution of bitcoin prices from the fourth quarter of 2012 through the fourth quarter of 2020 is presented in Figure 3.
The price distribution data in Table 2, column 2 and Figure 4 were used for the analysis in this section. Figure 3 presents data on measures of central tendency such as the mean, median and mode; and measures of dispersion such as the range, minimum, maximum, and standard deviation (Ashley et al.; Frankfort-Nachmias and Nachmias, 2008) for the quarterly bitcoin price values used in the research.
Data in Figure 3 depict the respective highest (29,053.17) and lowest (4.91) quarterly bitcoin price values recorded during the research period. The highest value (US$29,053.17) describes performance of bitcoin in the global financial markets in an economic period (2020) characterised by portentous pandemic outbreak.
The historically-high per unit price of bitcoin recorded at the end of 2020 (US$29,053.17) affirmed the role of bitcoin and altcoins as viable investment alternatives during periods of uncertainties in the global financial markets. The lowest per unit price in the figure (US$4.91) was recorded in the fourth quarter of 2012, the early formative years of bitcoin and its gradual acceptance in the global virtual financial markets.
Figure 3: Statistics on Quarterly Bitcoin Prices
| Mean | 3834.05333333333 |
| Standard Error | 966.991815349138 |
| Median | 699.845 |
| Mode | #N/A |
| Standard Deviation | 5801.95089209483 |
| Sample Variance | 33662634.15428 |
| Kurtosis | 9.40809946307668 |
| Skewness | 2.65895907310304 |
| Range | 29048.26 |
| Minimum | 4.91 |
| Maximum | 29053.17 |
| Sum | 138025.92 |
| Count | 36 |
| Largest(1) | 29053.17 |
| Smallest(1) | 4.91 |
| Confidence Level (95.0%) | 1963.09773851402 |
Data in the figure indicate the range of quarterly bitcoin prices during the period is 29048.26 (US$29,048.26). This represents the difference between the highest (US$29,053.17) and lowest (US$4.91) quarterly bitcoin price values during the research period.
An obvious effect of the limited supply of bitcoin relative to its demand for daily trading purposes is an increase in the per unit price. Therefore, it was not a surprise to witness significant jump in price of bitcoin between the first quarter (US$6,427.70) and last quarter (US$29,053.16) of 2020 by about 352% ((US$29,053.16 – US$6,427.70) ÷ US$6,427.70) x 100% = (US$22,625.46 ÷ US$6,427.70) x 100% = 0.35199932 x 100% = 351.999 = 352%).
Total circulated bitcoins that were highly liquid in supply were 3 million; and the remaining 1.1 million circulated bitcoins (18.6 million – (14.5 million + 3 million) = 18.6 million – 17.5 million = 1.1 million) were liquid in supply.
Cumulatively, there were about 4.1 million circulated bitcoins readily available for buying and selling on the global virtual exchanges; the remaining 14.5 million were being hoarded; and these were equivalent to 77.96% during the period. The significant number of circulated bitcoins hoarded (14.5 million) was indicative of a bullish market trend in the medium-term.
The year 2017 is quite historic in the annals of bitcoin history. It is the financial year in which bitcoin’s price per token increased from US$5,000.00 to US$20,000.00 for the first time. However, the price could not be sustained over a long period; price per token plummeted by over 80% in less than three months after the initial exponential increase by 300% ((US$20,000 – US$5,000) ÷ US$5,000) x 100% = ((US$15,000 ÷ US$5,000) x 100% = 3 x 100% = 300%).
Due to the volatilities and resultant fluctuations, the per-token value of bitcoin at the end of the 2017 financial year was US$13,800; the second-highest in the history of bitcoin trading. Nonetheless, volatilities in the price movements of bitcoin have lessened in recent periods. For instance, in the last quarter of 2020, bitcoin’s price surged from US$10,000.00 in October 2020 to US$19,000.00 towards the end of November 2020; and increased further to US$29,053.17 at the end of December 2020.
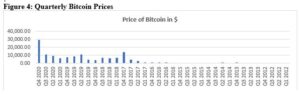
Data in Table 2 and Figure 4 reveal about 303.05% increase in the unit price of bitcoin between the fourth quarter of 2019 (US$7,208.30) and the fourth quarter of 2020 (US$29,053.17); and about 88.18% increase between the fourth quarter of 2018 (US$3,830.50) and the fourth quarter of 2019 (US$7,208.30).
Data in the table and figure indicate the per unit price of bitcoin in the early years was low. However, this period was characterised by astronomical increase in price per token of bitcoin as depicted in the significant jump in price of bitcoin (about 5,286.46%) from the fourth quarter of 2012 (US$13.51) to the fourth quarter of 2013 (US$727.71). The increase in per-token price of bitcoin from the first quarter of 2012 (US$4.91) to the fourth quarter of 2013 (US$727.71) was equivalent to 14,720.98%.
Generally, performance of bitcoin in the global cryptocurrency markets has been phenomenal over the years. This is evidenced in 591,614.26% increase in price per token from the first quarter of 2012 (US$4.91) to the fourth quarter of 2020 (US$29,053.17). Details of respective percentage increases in quarterly price of bitcoin over the research period (2012 through 2020) are presented in column 3, Table 2. Data in the table suggest the highest percentage increase in quarterly price of bitcoin (588.60%) was recorded between the fourth quarter of 2012 (US$13.51) and the first quarter of 2013 (US$93.03).
Percentage increase in price (491.15%) between the third (US$123.10) and fourth (US$727.71) quarters of 2013 remained the second-highest in the history of quarterly bitcoin prices. The respective third- (216.01%) and fourth-highest (169.16%) percentage increases in bitcoin prices were recorded between third (US$4,367.00) and fourth (US$13,800.00) quarters of 2017; and between third (US$10,794.00) and fourth (US$29,053.17) quarters of 2020.
Further, percentage increase in price of bitcoin (157.82%) between the first (US$4,167.60) and second (US$10,745.00) quarters of 2019 was equally impressive; it is the fifth-highest in the history of the virtual currency (bitcoin).
Market volatilities and the concomitant effect on price movements reflect in the negative percentage increases in quarterly prices in periods such as the third (-22.47%) and fourth (-13.48%) quarters of 2019; and the first quarter (-10.83%) of 2020, among others.
Observed volatilities in the virtual currency markets are affirmed by fluctuations in the per-token price of bitcoin and other cryptocurrencies. Between mid-February and 13th March, 2020, the value per token of bitcoin plunged from US$10,000.00 to less than US$4,000.00; and later appreciated to over US$6,000.00 towards the end of March 2020 (Salami, 2020b).
This development drew missed reactions from analysts; others were hopeful of bitcoin price bouncing back while others were pessimistic, and wondered whether per-token value of bitcoin would ever see the positive light-of-day in the global virtual financial markets. Trend analysis in Figure 4 reveals price volatilities were apparent from the first quarter of 2018 through the first quarter of 2019.
However, further trend analysis in Figure 4 depicts steady increase in per-token price of bitcoin from the fourth quarter of 2016 through the fourth quarter of 2017; and from the first quarter through the fourth quarter of 2020. Available data in Table 2 depict 42.36% increase in bitcoin price between the first and second quarters of 2020; and 17.96% increase between the second and third quarters of 2020.
It is worth-noting the marginal percentage increase in third quarter price of bitcoin (17.96%) did not affect its fortunes; market capitalisation value in the third quarter (US$199.689 billion) is the third all-time highest after the respective values recorded in the respective fourth quarters of 2020 (US$540,389 billion) and 2017 (US$231.564 billion) as shown in Table 3 and Figure 4.
In late October 2020, PayPal launched its service for purchases, sales and payments for bitcoin. This contributed to dramatic rise in price per unit of bitcoin in the last quarter of 2020; and expected to contribute to price increases beyond 2020. The virtual currency (bitcoin) has the potential of becoming a conventional payment method (Entrepreneur Staff, 2021).
On 30th December, 2020 bitcoin was traded at US$28,900, representing about 63.74% increase over the token price on 12th December, 2020 (US$17,650). The per-token value on 30th December, 2020 (US$28,900) was the new all-time high.
Table 2: Quarterly Bitcoin Prices
| Quarter | Price in $ | % Increase in Price |
| Q4 2020 | 29,053.17 | 169.16 |
| Q3 2020 | 10,794 | 17.96 |
| Q2 2020 | 9,150.60 | 42.36 |
| Q1 2020 | 6,427.70 | -10.83 |
| Q4 2019 | 7,208.30 | -13.48 |
| Q3 2019 | 8,331.10 | -22.47 |
| Q2 2019 | 10,745 | 157.82 |
| Q1 2019 | 4,167.60 | 8.80 |
| Q4 2018 | 3,830.50 | -42.12 |
| Q3 2018 | 6,618.10 | 3.55 |
| Q2 2018 | 6,391.50 | -7.71 |
| Q1 2018 | 6,925.30 | -49.82 |
| Q4 2017 | 13,800 | 216.01 |
| Q3 2017 | 4,367 | 80.40 |
| Q2 2017 | 2,420.70 | 123.79 |
| Q1 2017 | 1,081.70 | 11.67 |
| Q4 2016 | 968.62 | 58.98 |
| Q3 2016 | 609.28 | -9.33 |
| Q2 2016 | 671.98 | 61.62 |
| Q1 2016 | 415.78 | -3.29 |
| Q4 2015 | 429.94 | 81.90 |
| Q3 2015 | 236.36 | -9.98 |
| Q2 2015 | 262.55 | 7.55 |
| Q1 2015 | 244.13 | -22.99 |
| Q4 2014 | 317.00 | -18.12 |
| Q3 2014 | 387.14 | -39.51 |
| Q2 2014 | 640.01 | 41.60 |
| Q1 2014 | 452.00 | -37.89 |
| Q4 2013 | 727.71 | 491.15 |
| Q3 2013 | 123.10 | 26.24 |
| Q2 2013 | 97.51 | 4.82 |
| Q1 2013 | 93.03 | 588.60 |
| Q4 2012 | 13.51 | 8.95 |
| Q3 2012 | 12.40 | 85.35 |
| Q2 2012 | 6.69 | 36.25 |
| Q1 2012 | 4.91 | – |
Available data from CoinMarketCap and Glassnode (as cited in Del Rio, 2020a) revealed an increase in the unit price of bitcoin to US$28,925 during the period. The closing price per unit of bitcoin registered by Coindesk (as cited in Del Rio, 2020a) on 30th December, 2020 was US$28,969.
The Glassnode’s report (as cited in Del Rio, 2020a) depicted a promising future for bitcoin, given the few tokens or units available in the virtual exchange markets. The report indicated majority of traders acquired bitcoin as a store of value; only 4.1 million of the circulated 18.6 million bitcoins were traded in the virtual exchange markets.
In percentage terms, 78% of circulated bitcoins were stored as value while the remaining 22% were traded constantly in the virtual markets for profits or increased returns. The Glassnode report (as cited in Del Rio, 2020) showed the reluctance of some firms to sell their bitcoins, implying the recent bullish market conditions were triggered by high amount of financial illiquidity. The report concluded that shortage in bitcoin supply is a recipe for upward adjustment of its price per token in the global digital currency markets.
There were wild speculations and reports that per-token value of bitcoin could increase to US$100,000 or US$318,000 by the end of 2021. In October 2020, analysts at the global asset management department of JP Morgan Chase predicted the per-token value of bitcoin would double or triple.
The prediction was a paradigm shift from earlier pronouncement by Mr. Jamie Dimon, CEO of JP Morgan Chase, which sought to discredit bitcoin; he described bitcoin as “fraud” and “worse than tulip bulbs;” and would show any employee trading in bitcoin the exit door (Potts & Rennie, 2020). Currently, JP Morgan Chase is the largest bank in the United States. Realisation of these remarkable feat was enhanced by the acquisition of Washington Mutual (WAMU) over a decade ago.
Descriptive statistical test was conducted to help provide meaningful summary of market capitalisation values for bitcoin used in the research. Available data in column 4, Table 3 and Figure 6 were useful to the analysis in this section. Results from the statistical test are presented in Figure 5.
The statistical output in Figure 5 depicts respective median and mean of 15575409600 and 73823612396.9697; and standard deviation of 109060212550.166. These tell us the extent to which the observations are dispersed around the central tendency.
The mode explains the variable with the highest frequency or number of occurrences in the data. Figure 5 shows no absolute value (#N/A) for the mode. This implies no quarterly market capitalisation value for bitcoin was repeated. That is, there were no two or more quarters with the same market capitalisation values during the period.
Figure 5: Statistics on Quarterly Bitcoin Market Cap. Values
| Mean | 73823612396.9697 |
| Standard Error | 18984946158.7632 |
| Median | 15575409600 |
| Mode | #N/A |
| Standard Deviation | 109060212550.166 |
| Sample Variance | 1.18941299614875E+22 |
| Kurtosis | 9.74663288281368 |
| Skewness | 2.69738124849789 |
| Range | 540245620900 |
| Minimum | 143341100 |
| Maximum | 540388962000 |
| Sum | 2436179209100 |
| Count | 33 |
| Largest(1) | 540388962000 |
| Smallest(1) | 143341100 |
| Confidence Level (95.0%) | 38671069682.7074 |
Computed quarterly market capitalisation values for bitcoin is presented in Table 3 and Figure 6. Data in Figure 6; and in columns 1 through 3 in Table 3 were obtained from multiple sources, including Statista.com, Crowd Fund Insider, Yahoo Finance, Ycharts.com; the World Bank, IMF and OECD.
The fourth quarter price for bitcoin (US$29,053.17) for 2020 as depicted in the table and figure was derived from the average of different closing prices accessed from Yahoo Finance (US$29,001.72), Ycharts.com (US$29,388.94) and Statista.com (US$28,768.84).
Data on fourth quarter circulated bitcoins for December 2020 (18.6 million) were accessed from CrowdFundInsider.com; all the remaining quarterly prices and quarterly circulated bitcoins were obtained from Statista.com. The World Bank, IMF, OECD and Statista.com proved useful to gathering of data on annual global GDP values in column 3, Table 5.
Data on market capitalisation values for bitcoin are presented in column 4, Table 3. Market capitalisation value (MCV) for each quarter equals the number of circulated bitcoins (CB) multiplied by price per token (P) during the period. That is, MCV = CB x P. In effect, market capitalisation value equals total revenue derived from sales of circulated bitcoins during the period. Brown and Whittle (2020) reported over 40% increase in value of bitcoin in early December 2020. However, value-increases recorded by altcoins such as bitcoin SV, ethereum and bitcoin cash were in triple digits during the period.
Table 3: Quarterly Bitcoin Market Capitalisation Values
| Quarter | Circulated Bitcoins x | Price in $ = | Market Cap Value in $ | % Increase in Mkt. Cap |
| Q4 2020 | 18,600,000 | 29,053.17 | 540,388,962,000 | 170.62 |
| Q3 2020 | 18,500,000 | 10,794 | 199,689,000,000 | 18.47 |
| Q2 2020 | 18,420,000 | 9,150.60 | 168,554,052,000 | 43.30 |
| Q1 2020 | 18,300,000 | 6,427.70 | 117,626,910,000 | -9.99 |
| Q4 2019 | 18,130,000 | 7,208.30 | 130,686,479,000 | -12.71 |
| Q3 2019 | 17,970,000 | 8,331.10 | 149,709,867,000 | -21.68 |
| Q2 2019 | 17,790,000 | 10,745 | 191,153,550,000 | 160.31 |
| Q1 2019 | 17,620,000 | 4,167.60 | 73,433,112,000 | 9.86 |
| Q4 2018 | 17,450,000 | 3,830.50 | 66,842,225,000 | -41.62 |
| Q3 2018 | 17,300,000 | 6,618.10 | 114,493,130,000 | 4.63 |
| Q2 2018 | 17,120,000 | 6,391.50 | 109,422,480,000 | -6.78 |
| Q1 2018 | 16,950,000 | 6,925.30 | 117,383,835,000 | -49.31 |
| Q4 2017 | 16,780,000 | 13,800 | 231,564,000,000 | 219.43 |
| Q3 2017 | 16,600,000 | 4,367 | 72,492,200,000 | 82.38 |
| Q2 2017 | 16,420,000 | 2,420.70 | 39,747,894,000 | 126.13 |
| Q1 2017 | 16,250,000 | 1,081.70 | 17,577,625,000 | 12.86 |
| Q4 2016 | 16,080,000 | 968.62 | 15,575,409,600 | 60.78 |
| Q3 2016 | 15,900,000 | 609.28 | 9,687,552,000 | -8.29 |
| Q2 2016 | 15,720,000 | 671.98 | 10,563,525,600 | 65.19 |
| Q1 2016 | 15,380,000 | 415.78 | 6,394,696,400 | -1.04 |
| Q4 2015 | 15,030,000 | 429.94 | 6,461,998,200 | 86.36 |
| Q3 2015 | 14,670,000 | 236.36 | 3,467,401,200 | -7.84 |
| Q2 2015 | 14,330,000 | 262.55 | 3,762,341,500 | 10.08 |
| Q1 2015 | 14,000,000 | 244.13 | 3,417,820,000 | -21.13 |
| Q4 2014 | 13,670,000 | 317.00 | 4,333,390,000 | -16.03 |
| Q3 2014 | 13,330,000 | 387.14 | 5,160,576,200 | -37.83 |
| Q2 2014 | 12,970,000 | 640.01 | 8,300,929,700 | 45.87 |
| Q1 2014 | 12,590,000 | 452.00 | 5,690,680,000 | -35.90 |
| Q4 2013 | 12,200,000 | 727.71 | 8,878,062,000 | 512.75 |
| Q3 2013 | 11,770,000 | 123.10 | 1,448,887,000 | 30.92 |
| Q2 2013 | 11,350,000 | 97.51 | 1,106,738,500 | 8.45 |
| Q1 2013 | 10,970,000 | 93.03 | 1,020,539,100 | 611.97 |
| Q4 2012 | 10,610,000 | 13.51 | 143,341,100 | – |
Statistics in the table and figure indicate the second-highest quarterly price per token of bitcoin was recorded in the fourth quarter of 2017 (US$13,800.00). However, during the same year, bitcoin recorded its first-ever all-time high per-token value of US$20,000.00, equivalent to £15,000.00 (Salami, 2020a).
The per token price of bitcoin in the third quarter of 2020 (US$10,794.00) is the third-highest after the price recorded in the fourth quarter of 2020 (US$29,053.17); and in the fourth quarter of 2017 (US$13,800.00).
There is no gain-saying the global stock markets were one of the hardest-hit by the COVID-19 pandemic in 2020; most stock markets struggled to break-even in the 2020 financial year. However, data in Figure 6 and Table 3 depict steady increase in the per-token value of bitcoin from first through the fourth quarters of 2020.
The virtual currency (bitcoin) witnessed respective 43.30% and 18.47% increases in price during the second and third quarters of 2020; and exponential increase (170.62%) in the last quarter. Tremendous performance of bitcoin in 2020 in spite of the COVID-19 outbreak explained the general behaviour of investors in the stock markets. That is, the tendency to look for viable alternative investments when stock prices begin to plummet in the global financial markets, owing to uncontrollable internal and external factors.
Under the circumstance, cryptocurrencies such as bitcoin rob-shoulders with gold as viable investment alternatives in the global financial markets. Swanepoel (as cited in Urquhart, 2020) projected overall growth in bitcoin’s market capitalisation value between 2020 and 2024 at 270%.
Data in Table 3 suggest the respective first- (611.97%), second- (512.75%), third- (219.43%) and fourth-highest (170.62%) percentage increases in market capitalisation values for bitcoin were recorded in the first quarter of 2013, fourth quarter of 2013, fourth quarter of 2017 and fourth quarter of 2020. Percentage increases in market capitalisation values for bitcoin in the second quarter of 2019 (160.31%); and second quarter of 2017 (126.13%) were equally impressive and significantly high.
In January 2020, Brown and Whittle (2020) predicted gradual dissipation of bitcoin and other cryptocurrencies from the global financial system; and that, the periods in which these virtual currencies denied central banks and giant corporate bodies of valuable sums of money were virtually over.
The authors’ argument suggested the market capitalisation values for bitcoin and altcoins at the end of the 2020 financial year would be less than their values at the beginning of the financial year. As at the time of the authors’ submission in January 2020, the market capitalisation value for bitcoin was US$133 billion.
Author’s Note
The above write-up was extracted from an earlier publication on “Effect of Bitcoin Trading on the Global Economy” by Ashley (2022) in the Global Scientific Journal.


