
- The LMI Value for Ghana for the third quarter of 2022 is 63.1.
- The LMI for the third quarter 2022 decreased by 2.8 to 63.1 from second quarter’s 65.9.
- Growth is INCREASING AT AN INCREASING RATE for Inventory Cost and Transport Prices.
- Growth is INCREASING AT A DECREASING RATE for Warehousing Capacity, Warehousing Utilization, Warehousing Prices, Transportation Capacity and Transportation Utilization.
- Inventory Levels are CONTRACTING.
For the first time since the onset of the index, inventory levels fell below the threshold of 50, at 43.2, indicating a decline in inventory levels. All other indicators showed growth (above the 50 threshold). Inventory costs and transportation prices exhibited increasing growth, while the other indicators exhibited growth at a decreasing rate.
The rate of growth in logistics activities slowed down slightly in the third quarter of 2022. A prime reason for this slowdown is the high cost of inventory and the associated cost of warehousing and transportation prices. Inventory costs and transportation costs were both at an all-time high for the year, at 94.2 and 97.1 respectively. Over the first three quarters of 2022, warehousing capacity and utilization as well as transportation capacity and utilization saw consistent decreases. The decline in inventory levels was also quite consistent but rather worrying as inventory levels correlate highly with logistics growth. The expectation was that inventory levels would pick up. However, that has not happened, and the downward trend continued into the third quarter. We think that this may be due to the increasing high cost of doing business in Ghana.
Researchers at the Centre for Applied Research and Innovation in Supply Chain – Africa (CARISCA) issued this report. The Logistics Managers Index (LMI) is a new tool developed by CARISCA, based at Kwame Nkrumah University of Science and Technology, for Ghanaian businesses and policymakers.
The calculated LMI for Ghana, along with the accompanying analysis of its components, provides useful insights for the government of Ghana, business decision-makers, market analysts and investors, as it offers a predictive indication of overall economic activity in the country.
The LMI report is made available quarterly at https://carisca.knust.edu.gh/LMI. Senior executives and managers of businesses in Ghana are invited to participate in the quarterly LMI surveys by visiting: https://www.surveymonkey.com/r/Q1–23–LMI
The LMI measures the growth or decline of Ghana’s logistics industry along three components: inventory, warehousing and transportation activities. The LMI for Ghana study utilizes eight metrics from the three components to capture Ghana’s logistics activities. The index measures combinations of inventory, warehouse and transportation activities and tracks the relationship between these variables to make inferences about their effects on the broader Ghanaian economy.
| Table 1: Logistics Activities | |
| Inventory Activities
1. Inventory levels 2. Inventory costs
|
Transportation Activities
3. Transportation capacity 4. Transportation utilization 5. Transportation prices |
| Warehousing Activities
6. Warehousing capacity 7. Warehousing utilization 8. Warehousing prices
|
An index score is calculated for each of the eight components, and an overall index score (i.e., an LMI value) is then evaluated as a composite of these components. This LMI value is expressed as a percentage with a mid-value/threshold of 50%. An LMI value above 50% indicates a growing logistics industry, while a value less than 50% indicates a contracting logistics industry.
This approach is an effective and a reliable way to identify prevailing trends in logistics activities. Due to its predictive nature, the LMI is also a useful tool for forecasting future trends in a modern economy (Rogers et al., 2018).
IMPORTANT TAKEAWAYS FROM THE THIRD QUARTER LOGISTICS MANAGERS INDEX FOR GHANA
The overall Logistics Managers Index (LMI) for Ghana for the third quarter of 2022 stands at 63.1, down 2.8 basis points from second quarter’s reading of 65.9. This decrease reflects a slight slump in the growth of Ghana’s logistics activities as a result of stresses in the economy prevailing from the general high cost of doing business, depreciation of the Ghanaian cedi against the United States dollar and high inflation rates.
- For the first time since the inception of the index in early 2022, one of the indicators (inventory level) was below the threshold value of 50%. Findings from the Q2 report indicated dwindling inventory levels, with several companies folding up as a result of the lack of inventory due to the prevailing high cost of doing business. A lot of the companies that were affected were from the Food and Beverage Industry.[1] Inventory levels decreased substantially from the first and second quarter levels in the third quarter. Several companies experienced low liquidity and were not able to restock due to the general high cost of doing business.
- Logistics costs were still rising in the third quarter, with the three key cost-related indicators (i.e., inventory cost, warehouse prices and transport prices) once more recording the highest values of the eight metrics (94.2, 84.5 and 97.1, respectively). There continued to be a carry-over of high cost of logistics operations from quarter to quarter. These cost increases were likely due to the exacerbation of the general economic distress in Ghana mainly due to the depreciation in the national currency against the U.S. dollar, which was trading at 14.74 cedis to one dollar during the Q3 survey (end of November 2022)[2] as compared to 12.45 cedis to one dollar,[3] during the Q2 survey (see figure 1 on page 5). The continued depreciation of the cedi against the dollar contributed immensely to the general cost of logistics. Unfortunately, the dollarization of Ghana’s economy affects logistics activities whenever there is a depreciation of the cedi against the dollar. The depreciation of the cedi affects warehouse rental rates and cost of imported inventory, which are often priced in U.S. dollars. Local fuel prices often fluctuate with global fuel prices, and this fluctuation also contributed to the increase in transportation prices in the third quarter.
- Warehouse capacity is at an all-time low of 55.8. There has been a substantial demand for more warehouse capacity albeit slowed down by low inventory levels. The state of dwindling inventory also affected warehouse utilization, with this indicator also at an all-time low of 51. Declining inventory levels make it a challenge for managers to utilize warehouse space. Companies are stuck with empty warehouses but, due to longer term contracts they are compelled to honor, agreements that are not as good for them as they were previously.
- Despite the outlook, respondents were optimistic of improved growth in logistics activities in the fourth quarter and projected an LMI of 65.8. In December 2022, the IMF and Ghanaian authorities agreed on a $3 billion injection of credit into the Ghanaian economy, which will hopefully have a positive impact in 2023.
- For the third quarter, there was a slump in the growth of the Electronic Payment System (EPS) Index (which gives an indication of the level of usage of electronic payment systems in Ghana). The value for this metric for the second quarter was 69.1, while the third quarter recorded a value of 61.0. This drop in EPS can be attributed to a slump in economic activities and the cost of doing business. Based on projections by respondents, however, we expect EPS use to pick up and achieve an index of 75.4 in the fourth quarter report.
RESULTS OVERVIEW
The third quarter results of the LMI summarize the responses of logistics and supply chain professionals obtained from multiple industries in Ghana between October and November 2022.
Overall, the third-quarter LMI for Ghana (63.1) is down by 2.8 from second quarter’s reading of 65.9. The report indicates a slight slump in general logistics activities, albeit with a consistent increase in the cost metrics of inventory costs, warehousing prices and transportation prices.
What was surprising in this quarter’s findings is that inventory levels moved into a declining position, with a value of 43.2 – a first of its kind since the onset of the index. This decline reflects the impact of economic upheavals on the logistics industry. The drop in inventory levels is the largest to date in the Ghana LMI (-13.7). Companies cut back on inventory purchases and did not restock due to the high cost of doing business.
Capacity and utilization metrics also consistently decreased. Observations over the last three quarters are that warehousing capacity, warehousing utilization, transportation capacity and transportation utilization consistently decreased (over the first three quarters of 2022).
It’s obvious from the third quarter LMI value of 63.1 that Ghana’s economic slump affected the growth of logistics activities, leading to the observed drop in the LMI value (-2.8). This result is not too surprising considering that the World Bank revised Ghana’s GDP growth rate downward from 5.5% to 3.5% by mid-year 2022.[4] The external factors that influenced the
Ghanaian economy in the second quarter seems to have extended into the third quarter, with inflation rates still high and investor confidence quite low. There is a lot of uncertainty with businesses and investors depending on a good outcome from the International Monetary Fund (IMF) bailout arrangement with the Ghanaian government mentioned previously. It’s interesting that the drop in inventory levels (43.2) in the third quarter was accompanied by an increase in inventory cost (94.1). These drops reflect the high cost of doing business and the basic laws of supply and demand.
Inventory costs were to a large extent steady in the first and second quarters but spiralled out of control in the third quarter. This was anticipated, however, and we predicted it in the second quarter report.
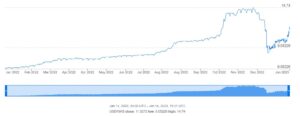
Figure 1.0: Comparison of the Ghana cedi against the dollar from January 14, 2022, to January 14, 2023 (Source: www.xe.com)
Warehousing prices remained almost steady at 84.6 (from the second quarter’s 85.1). This metric has remained quite steady despite the economic upheavals. This steadiness may be due to the tendency of logistics firms to set warehousing prices on a contract basis for the long term, thus shielding them from price fluctuations.
Transportation prices continued to register increases quarter after quarter, with this third-quarter value (97.1) being the highest since the beginning of the index. There was an increase of 0.5 from the second quarter’s value of 96.6. Obviously, the increase in transport prices is accounted for by macro-economic factors that have influenced the cost of doing business in general. This increase in the transportation index followed from the second quarter’s increasing trend. As expected, transportation prices were affected by the global surge in fuel prices. At the time of the third quarter survey (October – November), the price of gasoline in Ghana stood at 18.35 cedis per liter (see figure 2.0 below) compared to 12.32 cedis during the second quarter.[5]

Figure 2.0: Monthly prices of gasoline in Ghana from October 2022 to December 2022
(Source: Statista 2022)
Since the introduction of the Ghana LMI in June, the transport metric has been the metric with the highest value. This third quarter’s value of 97.1 is an all-time high. Together with the inventory metric, the transportation metric is a major contributor to the growth or decline of logistics activities in Ghana. Estimates from the Ghana Statistical Service have indicated that the greatest contributors to the current inflation rate in Ghana are fuel prices, transportation and food prices.[6]
Results from the third quarter also indicate that capacity and utilization metrics decreased. Transportation capacity, transportation utilization, warehousing capacity and warehousing utilization all decreased. This trend seems to be a continuation of what was observed in the second quarter.
Transportation capacity decreased from 71.8 in the second quarter to 68.8 (-3) in the third quarter.
As we reported in the second quarter, cost is a key performance indicator in the transport sector. Whenever fuel prices increase, shippers have a tendency to drop their capacity to minimize operational cost. The significant drop in inventory levels (-13.7) may also be a contributing factor to the drop in transport capacity. It is expected that transport capacity will bounce back when inventory levels pick up in the first or second quarters of 2023.
Transportation utilization also decreased from 65.8 in the second quarter to 59.4 (-6.4) in the third quarter. With the drop in inventory levels (-13.7) and the resultant high cost of doing business, transport utilization decreased as transporters held onto unused capacity.
Warehousing capacity also decreased from 56.6 in the second quarter to 56.0 (-0.6). This change is quite mild. Warehousing capacity has in the past been a pain point for Ghanaian supply chains since demand outstrips supply. However, dwindling demand makes the lack of capacity less serious. Hopefully, by the end of the year 2022, the realization of the $3 billion bailout by the IMF will improve the country’s economic situation, prepping up demand for more warehousing space.
Warehousing utilization has decreased from 62.8 in the second quarter to 51.1 in the third quarter
(-11.7). This drop is quite drastic implying that Ghanaian supply chains are currently under inventoried and unable to effectively utilize available warehouse capacity. In simple terms, a lot of Ghanaian companies are paying for empty or half-empty warehouses. It’s not surprising that some of the large retailers like GAME (South African Large Retailer) have folded up.
THIRD QUARTER OBSERVATIONS
The overall LMI in the third quarter (63.1) was lower than what we observed in the second quarter (65.9) with a delta of -2.8. This decrease is largely due to slump in inventory levels from 56.9 in the second quarter to 43.2 in the third quarter (delta of -13.7). In general, there were significant drops in the areas of warehouse capacity (-0.6), warehousing utilization (-11.7), warehouse prices (-0.5), transportation capacity (-3) and transportation utilization (-6.4).
Metrics that showed growth were inventory cost (delta of 5.3) and transportation prices (delta of 0.5). With the exception of the inventory level metric, all the other metrics registered values above the threshold of 50%. For the first time since the inception of the Ghana LMI, a metric (inventory level) fell below the 50% threshold. This raises a red flag and is an indication of a possible recession in the Ghanaian economy. Unless emergent measures are taken, the economy could end
up in a free fall. The hope is that the ongoing negotiation with the IMF bailout team will be concluded in good time and provide an economic stimulus for the Ghanaian economy.
A trend of declining growth in Ghana’s logistics industry seems to have emerged over the first three quarters of 2022. This can be attributable to the general slump in the Ghanaian economy brought on by increasing interest rates, high inflation and a depreciating local currency value against the dollar, which has negatively affected demand. It is clear that the rate of growth in the logistics industry was slowing down at a time when things should have been picking up.
The index scores for each of the eight components of the Logistics Managers Index, as well as the overall LMI index score for the third quarter, are presented in Table 2.0 (page 8). Two of the eight metrics (inventory costs and transportation price) are growing at an increasing rate. This is not surprising, as the cost metrics increased over the previous two quarters as well. The remaining six indicators showed growth (above the 50% threshold) at a decreasing rate.
For the third consecutive time transportation prices dominated as the metric with the highest value, followed by inventory cost, with warehousing prices coming in third. This observation has been consistent over each quarter of the LMI survey.
Globally, growth in the logistics sector seems to have continued a downward trend as a result of global economic and geopolitical factors (e.g., inflation, increasing fuel prices, Russia-Ukraine war). The LMI value for the USA (an economy with a GDP of $25 trillion compared to Ghana’s $74 billion) in November 2022 was 53.6. The overall index in the USA declined for six of the seven months leading up to November’s reading. Ghana’s situation therefore seems not to be an isolated case.
Respondents for the third quarter, however, remained optimistic that growth observed in the logistics sector in the third quarter of 2022 would increase in the future and predicted a future LMI value of 65.8. The results from the next survey (fourth quarter) will show whether these predictions held. However, expectations are high with the IMF bailout imminent.
Table 2.0: LMI Values for Ghana for the Third and Second Quarters of 2022
| LOGISTICS AT A GLANCE | |||||
| Index | Sep 2022 Index | June 2022 Index | Quarter-Over-
Quarter Change |
Projected Direction | Rate of Change |
| LMI® | 63.1 | 65.9 | -2.8 | Growing | Decreasing |
| Inventory Levels | 43.2 | 56.9 | -13.7 | Declining | Decreasing |
| Inventory Costs | 94.1 | 88.8 | 5.3 | Growing | Increasing |
| Warehousing Capacity | 56 | 56.6 | -0.6 | Growing | Decreasing |
| Warehousing Utilization | 51.1 | 62.8 | -11.7 | Growing | Decreasing |
| Warehousing Prices | 84.6 | 85.1 | -0.5 | Growing | Decreasing |
| Transportation Capacity | 68.8 | 71.8 | -3 | Growing | Decreasing |
| Transportation Utilization | 59.4 | 65.8 | -6.4 | Growing | Decreasing |
| Transportation Prices | 97.1 | 96.6 | 0.5 | Growing | Increasing |
PREDICTED FUTURE LMI VALUES FOR GHANA
Table 3.0 (page 10) also shows the predicted future values for all eight metrics from the third quarter survey (Sep 2022). To generate the predicted future LMI values for Ghana, we asked respondents to predict movements in the individual metrics for the next 12 months. Results show that the respondents are optimistic about the potential for increased logistics activities and reduced cost in the coming year.
They predicted continued growth in all metrics except for the cost metrics (inventory costs, warehousing prices and transportation prices), which were predicted to decrease. Inventory cost was predicted to drop by a margin of 7.2, warehouse prices by a margin of 2.2 and transportation prices by a margin of 7.8. This observation indicates a moderate level of optimism on the part of respondents that improvements in the general economy in the near future will reduce the cost of doing business and as a result bring down these cost metrics.
With the gradual stabilization of the cedi against the dollar, the expectation is that transport cost, which is very much influenced by the forex exchange, will decrease. Inventory costs also stand to benefit from improvements in the cedi’s depreciation against the dollar due to the fact that 60% of Ghanaian goods are imported. Warehouse prices, which are often quoted in dollars, will see a fall in the coming months as indicated by respondents
Respondents also anticipated a drastic rebound in the growth of inventory levels (from 43.2 to 64.9) as the economy picks up following fiscal improvements in the economy, which have led to an appreciation of the cedi against the dollar.
Table 3.0: Predicted Future Values of the LMI – Sep 2022
| LOGISTICS AT A GLANCE | ||
| Index | Sep 2022 – Current | Sep 2022 – Predicted future |
| LMI | 63.1 | 65.8 |
| Inventory Levels | 43.2 | 64.9 |
| Inventory Costs | 94.1 | 86.9 |
| Warehousing Capacity | 56 | 64.7 |
| Warehousing Utilization | 51.1 | 67.4 |
| Warehousing Prices | 84.6 | 82.4 |
| Transportation Capacity | 68.8 | 69.1 |
| Transportation Utilization | 59.4 | 68.8 |
| Transportation Prices | 97.1 | 89.3 |
Looking at the following 12 months, the predicted Warehouse Capacity index is 64.7 (up by 8.7) and warehouse utilization is 67.4 (up by 16.3). Transportation capacity and utilization were also expected to grow, with transportation capacity predicted at 69.1 (up by 0.3) while transport utilization is predicted at 68.8 (up by 9.4). Respondents expect to improve utilization of available warehouse space. Respondents are doubtful, however, that there might be any significant increase in transportation capacity. Figure 4.0 shows the future (predicted) values of the LMI indexes for the third quarter of 2022.

Figure 4.0: Future Predictions – Sep 2022
Use of Electronic Payment Systems
The Electronic Payment System Index (EPI), which was introduced in the second quarter of 2022, aimed at gauging the views of respondents (supply chain and logistics managers) on the usage patterns of electronic payment systems when transacting business with suppliers and customers. These electronic payment systems and methods make purchasing and procurement easier, more cost-effective and time saving.
Like the LMI, the EPI has a threshold of 50% and is developed as a diffusion index. The EPI for the second quarter registered a value of 69.1, while respondents predicted that usage of electronic payment systems would grow to a value of 80.7 in the next quarter.
In the third quarter, the EPI recorded a value of 61.0; a drop of 8.1 from second quarter’s 69.1. Respondents were optimistic about increasing growth in the third quarter, but the prevailing economic situation rather slumped the growth of electronic payment systems usage. The introduction of the electronic transaction levy of 1.5% in the first quarter of 2022 may also be a contributing factor. Nevertheless, an EPI of 61.0 indicates a healthy adoption of e-payment systems. With improvements in the macro-economy, adoption is expected to increase. Respondents predicted a future EPI of 75.4. It’s good news to know that this will grow in the future.

METHODOLOGY
Data for the Logistics Managers Index for Ghana are collected in quarterly surveys. Respondents for the study include senior logistics, supply chain and procurement executives and managers in the formal sector of the Ghanaian economy. Senior executives and managers are most likely to have macro-level information on inventory, warehousing and transportation trends in their organizations.
Data are also collected from professional members of the Chartered Institute of Logistics and Transport (CILT) and the Chartered Institute of Procurement and Supply (CIPS). Members of these professional bodies in Ghana tend to hold senior management positions in their organizations.
To ensure that the LMI value for Ghana is a true reflection of logistics activities in the Ghanaian economy, the respondents for this study were required to be working for organizations that operate in Ghana. Multiple industries were represented in the respondent pool: automobile and parts, telecommunications, shipping and transport, agriculture and agriculture business, manufacturing, mining, pharmaceuticals, industrial services, oil and gas/petroleum, and machinery and equipment.
A total of 292 valid responses were used for the Q3 2022 report.
To calculate the current LMI for Ghana, the diffusion index was used. The diffusion index has been used in the past to calculate other widely accepted indexes, such as the Purchasing Managers Index (PMI). This index gives an indication of whether the metric being evaluated is contracting or growing.
Values below 50.0 suggest a contraction, while values above 50.0 suggest growth in an activity (Getz and Ulmer, 1990). Thus, LMI values below 50.0 would be suggestive of contraction whereas values above 50.0 would suggest expansion in logistics activities.
The result of this third quarter of 2022 LMI for Ghana comes from an October-November 2022 survey of logistics and supply chain professionals in Ghana. It is expected that this survey will be repeated quarterly over the years to make it possible for analyses of trends and comparisons.
Respondents were asked to identify monthly change across the eight metrics collected in this survey. In addition, respondents were asked to provide predicted future trends for each metric for the next 12 months. The data were then analyzed using a diffusion index as used in the USA LMI study (Rogers et al., 2018).
Diffusion indexes are widely used to measure how widely a variable is spread across a group. The
Institute for Supply Management (ISM) has been using the diffusion index to compute the
Purchasing Managers Index since 1948. In keeping with the approach by Rogers, et al. (2018) and ISM, we computed the diffusion index as follows:
DI: 0.0 * PD + 0.5 * PU + 1.0 * PI
Where PD = % of respondents saying a category is declining, PU = % of respondents saying a category is unchanged, and PI = % of respondents saying a category is increasing.
ABOUT THE LOGISTICS MANAGERS INDEX FOR GHANA
The Logistics Managers Index (LMI) for Ghana is a study by the Center for Applied Research and Innovation in Supply Chain – Africa (CARISCA) at the School of Business at Kwame Nkrumah University of Science and Technology (KNUST) in Kumasi, Ghana. CARISCA is a collaboration between KNUST in Ghana and Arizona State University (ASU) in the United States, with support from the United States Agency for International Development (USAID). This study was led by Emmanuel Kweku Quansah (Ph.D.), Nathaniel Boso (Ph.D.) and Abdul Samed Muntaka (Ph.D.) of KNUST.
The Logistics Managers Index (LMI) for Ghana makes no representation other than that stated in this release regarding the individual company data-collection procedures. The data should be compared to all other economic data sources when used in decision-making.
This report is supported by the United States Agency for International Development and created by the Center for Applied Research and Innovation in Supply Chain – Africa (CARISCA), a joint project of Arizona State University and Kwame Nkrumah University of Science and Technology under award number 7200AA20CA00010.


