
The World Investment Report released in June 2022 showed foreign direct investment (FDI) into Africa reached a record US$83billion in 2021. The continent’s improved investment scorecard continues to drive capital flows to the region. However, irrespective of the upward flow of capital, Africa received only 5.2% of global FDI – up from 4.1% in 2020.[1] Emerging and frontier markets are increasingly receiving a large share of overall global capital, and so too is country-specific competition to attract this capital.[2]
As noted by Bright and Hruby (2015), wielding, attracting and efficiently utilising global capital is critical to national success. Notably, FDI flow into Africa remains concentrated in a handful of countries – South Africa, Mozambique, Nigeria, Senegal, Ghana, Ivory Coast, Ethiopia, Uganda, Egypt, Morocco, Congo, Gabon and DRC – which strive to create suitable environment to attract these investments. How do investors, especially those without first-hand African experience, assess the continent’s investing environments?
The Absa Africa Financial Markets Index (AFMI), introduced in 2017 comes in handy. The index assesses and ranks the investing environments (financial markets) of select African countries, highlighting opportunities and constraints. AFMI presents an essential toolkit for anyone (individual or institutional) evaluating the openness and attractiveness of African financial markets.
The index tracks annual progress made in each of these financial markets, and highlights the impact of policymakers, regulators and market participants on their sustainable development. Most importantly, the index presents dynamic metrics which can be improved upon by the respective indexed countries for growth and investor market-accessibility.[3]
AFMI uses both quantitative and qualitative analysis it its methodology to rank the selected financial markets via six selected pillars: market depth, access to foreign exchange, tax and regulatory environment, capacity of local investors, macroeconomic opportunities and enforceability of financial contracts. Countries are scored on a scale of 10-100 based on how they perform with respect to the six pillars, which comprise over forty indicators.
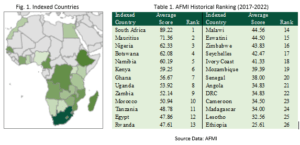
With seventeen (17) countries appearing in the inaugural publication of 2017, the indexed countries have grown to twenty-six (26) (see Fig.1). Thus, more than half of the continent’s sovereign nations remain outside the index. However, there is optimism that more of the continent’s sovereigns will be onboarded to foster growth and drive investments into those jurisdictions. South Africa has commanded the top spot since the index’s inception, and Mauritius and Botswana have been trading places for second rank status. However, Mauritius’ average score of 70 since inception of the index places it firmly after South Africa. Nigeria, Africa’s biggest economy, ranks third in the index. Botswana and Namibia complete the top five in fourth and fifth places respectively of the computed historical index ranking (see Table 1).
Strides in the Development of Ghana’s Financial Market (2017-2022)
Ghana’s financial market ranked seventh in the index’s inaugural edition with a score of 49 out of a possible 100, while an improved score of 55 maintained the country’s rank in the second edition (2018). Ghana’s overall ranking plummeted in the third edition (2019) to thirteenth. The drop in place was largely attributed to poor scorings in pillar two (access to foreign exchange) and pillar four (local investor capacity). The ranking rallied upward in the two consecutive years that followed – buoyed by stronger contractual and legal frameworks, and improved turnovers in the foreign exchange market.
Access to foreign exchange had weighed down Ghana’s ranking in the previous year. Gaining seven places in 2020 ranked Ghana’s financial market sixth among twenty-three indexed peers, scoring 59 in the process. An overall score of 62 pushed Ghana into the index’s top five ranking for the first time in 2021. The upward rally of Ghana’s market ranking was curtailed in 2022, evidenced by its three-place drop.
It is worth noting that Ghana’s financial market has consistently scored 50 and above in a minimum of four out of the six pillars measured since inception. Ghana’s overall score over the six years of publication averages 57. Hence, the market also averages seventh in rank (see Table 1). The policy initiatives and conditions that contributed to Ghana’s financial market performance since the index’s inaugural edition are discussed below within its own framework.

Market Depth
“Market depth evaluates the size and liquidity of domestic capital markets, along with the diversity of listed asset classes and existence of standard features that enhance market depth.”
Ghana has consistently scored 50 and above for the depth of its financial market, except in 2017 and 2020. Lower equity trading volumes on the Ghana Stock Exchange (turnover was about 1% of market capitalisation) dampened scores in 2017 (see Fig. 3).
Bond trading recorded a similar pattern, wherein investors usually hold the instrument to maturity – leading to lower levels of market activity. The score improved markedly to 55 in 2018 due to an increment in market capitalisation (118% of GDP) and increased activity in the bond market (turnover was 53%).
The existence of a functioning primary and secondary market for government instruments contributed positively. Other financial market initiatives – such as introducing the Ghana Alternative Market (GAX) to list small- and medium-size companies, and the Ghana Commodity Exchange (GCX) for trading soft commodities – were recognised as market depth-enhancing, thereby contributing positively to the score. The US$46.5billion government and corporate bonds listed on the local bourse also compared favourably to the US$12billion listed twelve months earlier.

Declined market capitalisation (17% of GDP), reduced turnovers in the equity (0%) and bond (43.1%) markets led to a drop in score for 2019 – irrespective of introducing legislation that permitted listing real-estate investment trusts on the local bourse, and US$78billon bonds being listed on the exchange. These factors deteriorated further within the twelve months that followed as the COVID-19 pandemic struck, giving rise to a score of 48 in the 2020 index.
However, there was a reversal in trend during 2021. Although market activity was still generally subdued, marginally improved market capitalisation (15.6% of GDP), equity (1.1%) and bond (110%) market turnovers contributed significantly. The launch of Ghana’s 10-year capital market master-plan was also recognised. Additionally, the introduction of sustainable bonds and ETFs (Exchange Traded Funds) did well for the market depth score.
Market capitalisation dropped in all AFMI countries for the 2022 index, due to capital flight owing to external factors – including global monetary policy tightening, fears of stagflation and the Russia-Ukraine war. This was further exacerbated by the depreciation of most African sovereign currencies. Ghana recorded its best-ever score of 56 in this pillar, aided by higher bond market turnover and enhanced product diversity.
Pension funds and commercial banks are credited with driving the observed turnovers. Since its introduction as an indicator for market depth, improving financial product diversity has been a focus for policymakers. Financial markets instruments such as equities, bonds (sovereign and corporate), ETFs, Green Bonds, commodities and other sustainable bonds are currently listed on the local bourse or are available through an OTC contract to meet the needs (liquidity, investment, risk management etc.) of all market participants.

Access to Foreign Exchange
“Access to foreign exchange considers the openness of markets to foreign investment. It looks at the severity of capital controls, interbank foreign exchange liquidity and reporting standards of exchange rate data. It also assesses the ability of central banks to manage volatility from foreign capital flows by considering the adequacy of FX reserves.”
Openness of the Ghanaian market to foreign investment improved from a score of 53 in 2017 to 58 in 2018. However, there was a significant decline to 38 in 2019 (see Fig. 5). Foreign exchange liquidity, gauged by foreign exchange trades in the interbank bank market, improved significantly from US$18bn to US$29bn in 2017 and 2018 respectively. Increased access to foreign exchange may be partly explained by the loosening of repatriation requirements required of exporters, which allowed foreign currency to flow through the commercial bank system.
However, there was a significant impairment of foreign exchange liquidity score in 2019. Ghana’s ranking among the indexed countries consequently deteriorated from ninth to seventeenth (see Fig. 6). Discounting the market activity (60%) of Ghana’s central bank in the interbank foreign exchange market accounted for this observation. The central bank is the recipient of yearly cocoa syndicated loans and proceeds of Eurobonds which eventually get channelled into the interbank market. Adjusting market activity for the central bank’s transactions reflected the true market activity.[4]
Ghana’s score and ranking improved in 2020 through a rise in foreign exchange liquidity, a decrease in the ratio of portfolio flows to reserves, and increased use of forward FX auctions. Significant growth in reserves by about 20% prior to COVID-19 also enabled foreign exchange reserves to hold up during the pandemic. Ghana’s rating and score rose even more in 2021, despite a fall in the interbank foreign currency market volume (see Fig. 6). Adopting the FX Global Code (important for transparency and international best practice) and more frequent official exchange rate reporting were the key drivers of Ghana’s performance.
Unlike the previous two years, Ghana’s ranking dipped in 2022 even though scoring improved. Generally, external shocks – spillovers from the Russia-Ukraine conflict, global monetary tightening – weakened FX reserves across the indexed countries. Ghana’s reserves have dropped by more than 20% and need rebuilding to stabilise the economy. But for more access to foreign capital in the future, implementing realistic homegrown policies will be necessary to reduce balance of payments and debt risks. Greater investment potential can be unlocked with foreign capital, but there are risks as well. It might make countries more susceptible to unforeseen capital outflows, as recently witnessed.

Market Transparency, Tax and Regulatory Environment
“Market transparency, tax and regulatory environment examines the transparency of financial markets alongside the tax and regulatory environments, each of which fosters local and foreign investor confidence. Environmental, social and governance indicators are also considered to assess sustainable market development.”
Ghana’s financial market consistently improved its score and ranking in the market transparency, tax and regulatory environment between 2017 and 2019 (see Fig. 7). This metric is the highest scorer for Ghana and highlights a transparent and regulated investing environment. The adoption of international accounting conventions such as International Financial Reporting Standards (IFRS), availability of quality human capital to implement same, and subsequent auditing of these processes contributed immensely to this recognition and ranking.
Moreover, the move by regulators to phase-in Basel II and some aspects of Basel III capital framework in bank capital adequacy requirement equally contributed to the higher scores. Tax breaks – exemption from VAT, NHIL and GETFL – for local fund managers, real-estate investment trusts and the non-taxation of capital gains also bolstered the 2020 score and ranking. The country’s tax policies were broadly considered to be supportive of capital market growth. Furthermore, corporate ratings by African rating agencies earn extra scoring points in this pillar. Ghana received 11 corporate ratings by the Johannesburg-based GCR in 2020, which aided transparency.
Guidelines for considering environmental, social and governance (ESG) factors in investment decisions were published by the National Pensions Regulatory Authority (NPRA). Consequently, the up-to-5% of a pension scheme’s managed assets that are invested in green bonds are exempt from the maximum allotment for securities. It was also reported that Ghana was working with the Global Reporting Initiative to introduce sustainability reporting in the country.
These policy decisions shored-up score and ranking in 2021. Developments in late 2021, such as signing a tax-treaty with Luxembourg and tax negotiations with Iran and Turkey, counted well for the 2022 score and ranking. However, the coming to an end of tax exemption on capital gains for securities listed on the GSE and introduction of the ‘E-levy’ – which adds a 1.5% tax on all electronic transactions above 100 Ghana cedis – made Ghana’s tax regime considerably less favourable to investors in 2022.

Capacity of Local Investors
“Capacity of local investors evaluates the potential for institutional investors to drive capital market growth based on the size of pension fund markets, both in per capita terms and relative to local listed securities. Financial inclusion strategies are also examined.”
Local investor capacity ranking improved considerably over the period from 15 to 9 in 2017 and 2019 respectively. The country dropped two places in 2020 and 2021 before gaining three to place eight in 2022. Irrespective of the rankings, scores for the index’s six years of publication were far below the average score of 50. Capacity of local investors stands out as Ghana’s worst-scoring metric in the index. Per capita assets under management (AUM) and assets under management as a ratio of domestic financial market assets are the key indicators of this pillar.
Although regulatory reforms have helped boost the asset base of pension funds over the last decade, the AUM of both pension funds and insurance companies have significantly and consistently been lower than the index average. Per capita assets under management have been below US$200million over the review period. Notably, pension assets remained heavily invested in government securities. The 2021 report notes that many asset managers and pension funds in the country had short-term outlook on investments, which made them more risk-averse and less likely to invest in unproven sectors.
With 89 percent invested in bills and bonds, Ghana’s pension portfolio was the most concentrated among the indexed countries in 2022. This lack of diversification hurt returns, which decreased by around 10 percent in real terms as a result of the sell-off of the nation’s sovereign bonds. It is the belief that many trustees’ lack of sufficient capital market expertise is causative of the aforementioned portfolio concentration. Hence, it is crucial to build capacity; particularly when markets grow and new asset classes emerge, to enable trustees and fund managers comfortably assess novel investment opportunities.

Macroeconomic Environment and Transparency
“Macroeconomic environment and transparency look at countries’ underlying macroeconomic environments and the transparency of economic data which underpin the development of their financial markets.”
As evident in Figure 11, incremental scores over the six-year period were recorded by Ghana. It is one of two pillars in which Ghana scores 50 and above for indicators measured in the three key areas of: economic performance (GDP growth and export competitiveness), financial risks (debt profile and health of banking sector) and macro transparency (transparency in monetary and fiscal policy communications). GDP growth of 3.7% prior to the 2017 index more than doubled in the ensuing period. Favourable trade conditions for chief export commodities contributed to a robust export market.
However, mounting public debt and weakening of the banking sector (insufficient capital to absorb unexpected losses) negatively impacted the scoring. Ghana recorded the highest Non-Performing Loan (NPL) ratio among the indexed countries. Periodic publication of the Monetary Policy Committee’s policy decisions, economic data as well as promulgation of the Public Financial Management Act, 2016 influenced the above-average score positively. Resource-driven exports strengthened Ghana’s ranking in 2018 with a score of 57, even though terms of trade deteriorated over the period. The merger of five commercial banks which did not meet the capital requirements set in 2017 paved the way for Consolidated Bank Ghana’s arrival.
A near-constant year on year growth rate and improved credit quality (lower NPLs) propelled the score to 59 in 2019. Economic growth forecasts were subdued in 2020 due to the impact of COVID-19. Nonetheless, Ghana recorded its highest-ever score of 65 in this pillar during the period. Averaging a five-year historical growth rate of 5 percent, Ghana’s economy was expected to bounce back more strongly than did other indexed economies. As oil prices took a dive, a diversified export market of gold and cocoa helped cushion the shock.
Economic constraints induced credit quality deterioration in 2021. Public debt as a percentage of gross domestic output fell in the IMF’s debt-distressed category. Nonetheless, the country was able to maintain its previous score of 65 in 2021. Shocks from the Russia-Ukraine war and global monetary tightening cycle surfaced as a danger to macroeconomic growth and stability, just as economies were recovering from the COVID-19 pandemic.
Debt vulnerability lingers on as the economy navigates the terrain of high-risk for debt distress. Sharp increases in inflation exacerbated by a rapidly depreciating cedi weighed on the 2022 score of 63. Policymakers have had to take decisive actions in the face of numerous global shocks. This and many more policy responses are expected as the market becomes increasingly integrated with the world economy, especially in an evolving digitised universe.

Legal Standard and Enforceability
“Legal standard and enforceability consider countries’ alignment with international legal and contractual standards across financial markets, evaluated by their adoption of standard master agreements and enforceability of close-out netting and collateral provisions.”
The use of financial market master agreements, netting and collateral positions and insolvency frameworks are the three key indicators of this pillar. Ghana’s financial market obtained higher scores in legality and enforceability of financial contracts entered into by parties within its jurisdiction. A score of 67 in the maiden edition was improved upon to 74 in the subsequent ranking (see Fig. 8). However, a decline to 55 in the 2019 ranking reflected identified weaknesses with respect to developments in the Ghanaian market. The use of master agreements developed by the International Swaps and Derivatives Association (ISDA) was well-recognised in Ghana’s financial market.
However, unlike the ISDA, Global Master Repurchase Agreement (GMRA) and Global Master Securities Lending Agreement (GMSLA) were in limited use and not in use respectively. The adoption of GMRA and legal revisions to allow close-out netting helped Ghana inch up its 2020 score to 78. Guidelines for the repo market and use of GMRA by the Bank of Ghana were published. This consequently standardised Ghana’s repo market, and thereby reduced risk while enhancing legal certainty. The strides made by the Bank of Ghana in recognising netting arrangements for transactions using global standard documents and commissioning ISDA opinions on the country’s netting-off and insolvency regime culminated in a score of 100 in 2021.
The adoption of GMSLA by market participants also boosted the country’s score. However, adopting the features of GMSLA remained limited a year after, and thereby slightly weighed down the 2022 score to 95. As reported, a technical committee has been set up to produce guidelines for securities lending and borrowing, and work on adopting GMSLA. Undoubtedly, this will enhance a wider adoption of this global master agreement, reduce counterparty risk and deepen market development.
>>>AZTEC MFB
E-mail:[email protected]
Web: www.aztecmfbank.com
[1] World Investment Report 2022 (UNCTAD)
[2] Bright, J. and Hruby, A. (2015). The Next Africa. An Emerging Continent Becomes a Global Powerhouse.
[3] Barclays Africa Group Financial Market Index 2017
[4] Absa Financial Market Index 2019


