
The break-even point (BEP) and break-even analysis are related financial concepts used to assess a business’s financial health. The break-even point is the specific level of sales at which total revenues equal total costs, meaning there is no profit or loss. It is calculated by dividing fixed costs by the difference between the unit selling price and variable cost per unit.
On the other hand, break-even analysis is a broader financial assessment that examines the relationship between costs, volume, and profits at various levels of production and sales. It helps businesses determine how changes in costs, prices, and sales volumes impact profitability, providing valuable insights for strategic planning and decision-making. We delve into the core components of break-even analysis, explore its applications, acknowledge its limitations, and highlight its importance in business planning, drawing insights from academic research.
A LITTLE HISTORY ALWAYS HELPS
Concepts like break-even point (BEP) can be found in the writings of 18th-century economist Antoine Cournot. Cournot’s idea of the “point of indifference” referred to the production level where a firm neither gains nor loses profit.
German economist Karl Bücher is often credited as the pioneer of BEP. His work, “Betriebsmittel und Betriebs organisation in Deutschen Handwerk und Manufakturbetrieb des 16. Jahrhunderts” (Operating Resources and Business Organisation in German Handicraft and Manufacturing Businesses of the 16th Century), published in 1893, discussed the importance of understanding cost behaviour and the relationship between costs and revenue.
Another German economist, Johann Friedrich Schär, is recognised for his contributions to BEP. His book, “Grundzüge der Kalkulation” (Fundamentals of Costing), published in 1910, elaborated on the concept of the “dead point,” which referred to the production volume where total costs equal total revenue.
Since then, BEP has undergone further refinement. Accounting practices have evolved to better categorise fixed and variable costs, and technological advancements have facilitated more sophisticated cost analysis and modelling.
KEY COMPONENTS OF FORMULAS
Fixed Costs (FC)
Fixed costs are expenses that remain constant regardless of the level of production or sales. These expenses do not vary with changes in output. Examples of fixed costs include rent for facilities, salaries of permanent staff, insurance premiums, property taxes, loan payments, and asset depreciation. Even if production is halted or sales decline, fixed costs persist.
In break-even analysis, it is essential to identify and quantify fixed costs accurately because they represent the baseline expenses that must be covered before a business can start making a profit. These expenses remain constant regardless of the production volume.
Variable Costs (VC)
Variable costs are expenses that fluctuate in direct proportion to changes in production or sales volume. Unlike fixed costs, variable costs increase as production levels rise and decrease when production levels decrease. Examples of variable costs include raw materials, direct labour, packaging materials, and utilities such as electricity and water. Variable costs are directly tied to the level of output and are typically expressed on a per-unit basis.
Identifying and calculating variable costs accurately is crucial in break-even analysis as they directly impact the profitability of each unit produced or sold. These expenses vary directly with the production volume. Examples include raw materials, direct labour costs associated with production, and utilities used in the manufacturing process.
Total Cost (TC)
Total costs represent the sum of fixed costs and variable costs incurred by a business. They reflect the overall expenses incurred to produce a given level of output. Total costs provide a comprehensive view of your business’s financial health and represent the minimum revenue required to cover all expenses and achieve break-even.
By understanding total costs, businesses can assess their pricing strategies, production levels, and overall cost structure to optimise profitability. Total costs represent the sum of fixed costs and variable costs (TC = FC + VC).
Selling Price (SP)
The Selling Price (SP) is the amount of money at which a good or service is sold to customers. It represents the revenue generated from each unit of product sold. The selling price is determined by several factors, including production costs, market demand, competition, and desired profit margins.
In break-even analysis, the selling price is a crucial variable as it directly influences the revenue generated by a business. By analysing the relationship between the selling price and the cost structure of the business, companies can determine the level of sales required to cover expenses and achieve profitability. Setting an appropriate selling price is essential for maximising revenue while remaining competitive in the market.
Contribution Margin (CM)
Contribution Margin (CM) is a key financial metric that represents the amount of money earned per unit of product sold, which contributes to covering fixed costs and generating profit. It is calculated by subtracting the variable costs per unit (VC) from the selling price per unit (SP).
The contribution margin reflects the portion of revenue available to cover fixed costs and contribute to profit after accounting for variable costs. It represents the excess revenue available to the business beyond variable costs.
In break-even analysis, the contribution margin is a critical factor for determining the profitability of each unit sold and assessing the overall financial health of the business. By calculating the contribution margin, companies can evaluate the impact of pricing decisions, cost structure changes, and sales volume fluctuations on their profitability. Maximising the contribution margin allows businesses to cover fixed costs more efficiently and increase profitability.
The contribution margin represents the amount of money earned per unit of product sold that contributes to covering fixed costs and generating profit (CM = SP – VC).
Break-Even Point (BEP) Formulas
Two primary formulas are used to calculate the break-even point.
Units: BEP (Units) = Fixed Costs (FC) / Contribution Margin (CM)
Revenue: BEP (Revenue) = Fixed Costs (FC) / (Selling Price (SP) – Variable Cost per Unit)
Because both denominators speak to the same metric, both formulas give you the same measure of your Break-Even Point (BEP).
APPLICATIONS OF BREAK-EVEN ANALYSIS
Pricing Strategies
Break-even analysis provides businesses with valuable insights into the relationship between pricing decisions and profitability. By analysing the impact of price changes on the Break-Even Point (BEP), businesses can determine optimal pricing strategies that maximise revenue and profitability.
For example, businesses can use break-even analysis to assess the sensitivity of demand to price changes and identify pricing thresholds that yield the highest profits while remaining competitive in the market.
Production Planning
Break-even analysis helps businesses determine the production levels necessary for profitability and avoid overproduction or underproduction. By understanding the relationship between production volume, variable costs, and fixed costs, businesses can optimise production planning processes to minimise costs and maximise profits.
For instance, break-even analysis can guide decisions regarding production capacity utilisation, inventory management, and scheduling to align with demand fluctuations and market conditions.
Cost Management
Break-even analysis enables businesses to gain insights into their cost structure and its impact on profitability. By identifying the components of fixed costs and variable costs, businesses can implement cost-reduction strategies to improve efficiency and competitiveness.
For example, businesses can use break-even analysis to evaluate the cost-effectiveness of outsourcing certain activities, renegotiating supplier contracts, or investing in technology upgrades to streamline operations and reduce expenses.
Budgeting and Forecasting
Break-even analysis serves as a valuable benchmark for budget setting and helps businesses forecast sales targets needed to achieve profitability. By estimating the Break-Even Point (BEP) and analysing the relationship between sales volume, revenue, and costs, businesses can develop more accurate budgets and financial projections. This enables businesses to set realistic targets, allocate resources effectively, and monitor performance against strategic objectives.
Break-even analysis provides businesses with actionable insights and strategic guidance across various areas, including pricing strategies, production planning, cost management, and budgeting. By effectively leveraging break-even analysis, businesses can make informed decisions to optimise profitability, mitigate risks, and achieve sustainable growth in today’s competitive business environment.
A SHORT STORY TO DEMONSTRATE THE APPLICATIONS
Awa, the actual name of my really good friend, stood in her tiny Accra bakery, “Awa’s Delights,” staring at the rows of unsold pastries. Her heart sank. She poured her passion and savings into this dream, but customers were not coming in droves. Self-doubt gnawed at her. Was her pricing wrong? Were her delicious coconut bites and mango turnovers too expensive?
Desperate for answers, Awa remembered a business seminar she attended with the Africa School of Entrepreneurship that mentioned “break-even analysis.” Intrigued, she dug out her notes. Fixed costs – rent, utilities, loan payments – were clear. Variable costs – flour, sugar, spices – she could track on her receipts. But the key was the selling price. Were her prices high enough to cover all her expenses and still turn a profit?
Armed with a calculator and her notebook, Awa spent a sleepless night crunching the numbers. She calculated her contribution margin – the profit earned on each pastry after accounting for variable costs. Then, with a racing heart, she plugged the numbers into the break-even formula. The answer stared back at her: she needed to sell 20 pastries a day to break even!
Awa’s initial despair turned into determination. Selling 20 pastries was not impossible. She revisited her break-even chart. If she lowered the price slightly, the break-even point would change. But how much could she afford to reduce it? She needed to find a sweet spot between attracting customers and making a profit. She adjusted the price so that she now needed to sell 30 pastries a day to break even.
The next day, Awa implemented a strategic price reduction. She also started offering combo deals and introduced smaller portion sizes for budget-conscious customers. The impact was immediate. Lines formed outside her bakery. Awa, now a whirlwind of activity, baked furiously, her heart filled with a new kind of sweetness – the taste of success.
By applying break-even analysis, Awa transformed her business. She understood her costs, adjusted her pricing strategy, and attracted a wider customer base. “Awa’s Delights” was no longer just a dream; it was a thriving bakery, a testament to the power of knowledge and a well-placed pastry business.
VISUALISING BREAK-EVEN ANALYSIS
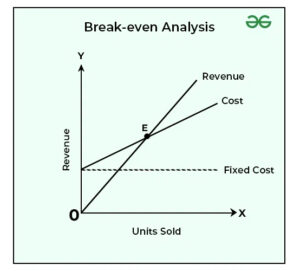
In the above graph, the X-axis shows units being sold, and the Y-axis shows the revenue made. The cost line shows the total cost that occurs during the production process, the fixed cost line shows the occurrence of fixed costs, and the revenue line shows the total sales being made. The intersection of the revenue curve and cost curve determines the break-even point, i.e., point E.
LIMITATIONS OF BREAK-EVEN ANALYSIS
Break-even analysis has limitations that businesses should be aware of:
Assumed Linear Relationships
Break-even analysis relies on several simplifying assumptions to make calculations more manageable. These assumptions include a constant selling price per unit, linear variable cost behaviour, and unchanged fixed costs. However, these assumptions may not hold for all businesses or situations.
For example, selling prices may fluctuate due to changes in market demand or competition, variable costs may vary nonlinearly with production volume, and fixed costs may change over time due to factors such as inflation or regulatory requirements. As a result, break-even analysis may produce inaccurate results if these assumptions do not reflect the actual conditions faced by the business. It assumes fixed costs remain constant and variable costs increase linearly with production.
Ignores External Factors
External factors such as changes in market demand, competition, technological advancements, or economic conditions can have a significant impact on sales and profitability. Ignoring these external factors in break-even analysis can lead to unrealistic projections or strategic decisions that fail to account for the broader business context. Businesses should supplement break-even analysis with market research, competitive analysis, and economic forecasting to make more informed decisions.
Limited Long-Term Focus
It does not provide information about maximising profits, optimising performance, or identifying growth opportunities. Businesses need to complement break-even analysis with other financial metrics and analytical tools to gain a comprehensive understanding of their financial performance and strategic options.
For example, businesses may use techniques such as sensitivity analysis, scenario planning, or investment appraisal to assess the impact of different scenarios on profitability and make more robust strategic decisions. Break-even analysis primarily focuses on the short-term picture. It may not be suitable for long-term planning, where factors like product life cycles and technological advancements must be considered.
MITIGATING LIMITATIONS OF BREAK-EVEN ANALYSIS
Despite its limitations, businesses can proactively address the challenges of break-even analysis. By incorporating specific strategies and techniques, businesses can mitigate the limitations and enhance the effectiveness of break-even analysis.
Using Scenario Analysis
Scenario analysis evaluates break-even points under different assumptions for costs, selling price, and sales volume. By considering various scenarios, businesses can gain a broader picture of their financial performance and risk exposure.
For example, businesses can analyse best-case, worst-case, and most likely scenarios to assess the impact of different factors on break-even points and profitability. Scenario analysis enables businesses to anticipate potential outcomes and make more informed decisions in dynamic and uncertain environments. Analysing BEP under different assumptions for costs, selling price, and sales volume provides a broader picture.
Incorporating External Factors
Integrating market research and competitive analysis with break-even analysis allows businesses to adjust their strategies and plans to external influences. By considering changes in market demand, competitive dynamics, technological advancements, and economic conditions, businesses can better understand the drivers of sales and profitability.
For instance, businesses can conduct market surveys, monitor competitor activities, and analyse industry trends to identify opportunities and threats that may impact break-even points and financial performance. Incorporating external factors into break-even analysis enables businesses to adapt their pricing strategies, production plans, and cost management initiatives to changing market conditions and customer preferences. Integrating market research and competitive analysis with BEP can help businesses adjust to external influences.
Sensitivity Analysis
Sensitivity analysis involves assessing the impact of changes in key variables on the break-even point and overall profitability. By varying factors such as sales volume, selling price, and costs, businesses can identify the most critical drivers of profitability and assess the sensitivity of the break-even point to changes in these variables. Sensitivity analysis helps businesses understand the degree of risk associated with different scenarios and make informed decisions to mitigate risks and maximise opportunities.
Cost-Volume-Profit (CVP) Analysis
Cost-Volume-Profit (CVP) analysis expands on break-even analysis by incorporating additional insights into the relationship between costs, volume, and profit. CVP analysis considers factors such as contribution margin, profit targets, and breakeven sales levels to provide a more nuanced understanding of the business’s financial performance. By analysing the interplay between costs, volume, and profit, businesses can identify opportunities for cost optimisation, pricing adjustments, and revenue enhancement.
Budgeting and Forecasting
Integrating break-even analysis into budgeting and forecasting processes allows businesses to set realistic targets and track progress towards profitability. By incorporating break-even sales targets into budget projections, businesses can allocate resources effectively, prioritise investments, and monitor performance against strategic objectives. Break-even analysis provides a benchmark for assessing the financial feasibility of business plans and adjusting budgets and forecasts based on changing market conditions.
Investment Appraisal
Break-even analysis can be used in conjunction with investment appraisal techniques such as net present value (NPV) and internal rate of return (IRR) to evaluate the financial viability of investment projects. By comparing the break-even point with the expected cash flows and returns from an investment, businesses can assess the risk and return profile of the investment opportunity. Integrating break-even analysis into investment appraisal allows businesses to make informed decisions about capital allocation and resource allocation, ensuring that investments contribute positively to overall profitability.
THE SIGNIFICANCE OF BREAK-EVEN ANALYSIS
Break-even analysis is a fundamental tool in financial management that provides valuable insights into the relationship between costs, revenue, and profitability. By identifying the break-even point – the level of sales at which total revenue equals total costs – businesses can assess the financial feasibility of their operations, set pricing strategies, and make informed decisions to achieve profitability. Throughout this article, we have explored the various aspects of break-even analysis, including its components, applications, limitations, and techniques for enhancement.
At its core, break-even analysis serves as a guiding light for businesses navigating the complexities of the marketplace. It enables businesses to understand the minimum level of sales needed to cover costs and avoid losses, thereby providing a foundation for strategic decision-making. By analysing fixed costs, variable costs, selling prices, and contribution margins, businesses can optimise their cost structures, set realistic sales targets, and maximise profitability.
Furthermore, break-even analysis extends beyond mere financial calculations. It is a strategic tool that empowers businesses to adapt to changing market conditions, mitigate risks, and seize growth opportunities. Whether it is pricing strategies, production planning, cost management, or budgeting and forecasting, break-even analysis provides a framework for informed decision-making across various facets of business operations.
As mentioned earlier, it is, however, essential to recognise the limitations of break-even analysis, including its reliance on simplifying assumptions and its inability to account for external factors. While these limitations may pose challenges, businesses can mitigate them by incorporating other analytical techniques such as sensitivity analysis, cost-volume-profit analysis, and scenario planning. By combining break-even analysis with these complementary approaches, businesses can gain a more comprehensive understanding of their financial performance and strategic options.
Break-even analysis remains a cornerstone of financial management, providing businesses with invaluable insights into cost structure, pricing strategies, and profitability. As businesses navigate the complexities of the marketplace, break-even analysis serves as a guiding compass, helping them chart a course towards sustainable growth and success. By harnessing the power of break-even analysis and complementary analytical techniques, businesses can make informed decisions, optimise performance, and achieve their long-term objectives in today’s dynamic and competitive business environment.
I hope you found this article insightful and enjoyable. Your feedback is highly valued and appreciated. I welcome your suggestions for topics you want me to address or provide insights on. You can schedule a meeting with me at your convenience through my Calendly at calendly.com/maxwellampong. Alternatively, you may connect with me through various channels on my Linktree page at https://linktr.ee/themax.
I wish you a highly productive and successful week ahead!
♕ —- ♕ —- ♕ —- ♕ —- ♕

Dr. Maxwell Ampong serves as the CEO of Maxwell Investments Group. He is also an Honorary Curator at the Ghana National Museum and the Official Business Advisor with the General Agricultural Workers Union of Ghana (GAWU) under Ghana’s Trade Union Congress (TUC). Dr. Ampong writes on relevant economic topics and provides general perspective pieces. “Entrepreneur In You” is supported by GCB Bank PLC and operates under the auspices of the Africa School of Entrepreneurship.


