")
Thursday, the 11th of March 2021, marked the tenth anniversary of the devastation that befell the Fukushima Dai-Ichi nuclear power station in Japan. The immediate cause of this unfortunate accident was the unprecedented 17 meters high tsunami waves that easily overwhelmed the seawalls outside of the facility that stood at no more than 7 meters.
This mammoth tsunami was triggered by an unprecedented 9.0 magnitude earthquake on the northeastern coastline of Pacific Ocean at 2.46pm local time on Thursday, 11th of March in 2011. All the three reactors, which were in operation on that day, automatically shut down as per the in-built safety mechanisms. However, when the tsunami flooded the power station about 40-50 minutes later, the cooling systems were inundated, and that stared the crises at the power station.
Prior to Fukushima, there had been two other notable nuclear accidents. 28th March 2021 will mark the 42nd anniversary of the first major nuclear power accident that took place at the Three Mile Island Nuclear Power Station in the State of Pennsylvania, in the USA in 1979. We shall learn in discussions later that that reactor could have continued to function without any interventions of the operator.
Lastly, the accident at Chernobyl Nuclear Power station in Ukraine, which took place at Unit-4, the newest of the four operating reactors at the time at the site. The accident occurred at 1.30am on the 26th of April 35 years ago. The three operators who triggered the unfortunate incident, had started their shifts after midnight, thus in the early hours of 26th of April. They decided to conduct an important experiment which had been originally scheduled to be performed by scientific experts during the normal working hours of the 25th of April. The experiment was meant to be carried out when the power of the reactor had been reduced to below 25% of its power. Unfortunately, the reactor surged very high, making the Chernobyl accident the most devastating of the 3 major nuclear accidents.
The names of the 3 major nuclear accidents are often raised when discussing nuclear safety and conjure fear and concerns about nuclear energy. But this is far from the truth. Note, for example, that the USA has operated the largest fleet of reactors over the 60 years without any fatalities. The same is true for France, Belgium, Switzerland, Sweden and several countries where nuclear power is substantially used as part of their energy mix. In fact, thousands of people, mostly mothers and their children, die prematurely each year in developing countries from indoor pollution, induced by charcoal, while in the industrialized countries, some premature deaths occur due to outdoor pollution from excessive use of fossil fuels.
Despite several gloomy predictions of thousands of deaths from the Fukushima accident, nobody died from that. Of course, there were several unfortunate fatalities linked to the tsunami and earthquake. A table below shows that in the 2011, there were 15 fatal accidents associated with power, and about 97 fatal accidents in the last decade, with no fatalities from nuclear power in the same timeframe.
Fatal accidents
Number of fatal accidents: 154
| Year | Before 2000 |
2000- 2005 |
06 | 07 | 08 | 09 | 10 | 11 | 12 | 13 | 14 | 15 | 16 | 17 | 18 | 19 | 20 |
| No. | 24 | 16 | 5 | 5 | 11 | 8 | 8 | 15 | 17 | 5 | 3 | 8 | 6 | 9 | 3 | 5 | 6 |
For more information about accident statistics related to wind power, please see: http://www.caithnesswindfarms.co.uk/AccidentStatistics.htm
We explore the three unfortunate nuclear accidents in depth in the next 3 episodes, starting with the first one, the Three Mile Island accident. This will be followed by the Chernobyl accident and then lastly, the Fukushima accident.
The 3 nuclear power reactors involved in these accidents differ from each other. They were PWR, RBMK and BWR for Three Mile Island, Chernobyl and Fukushima facilities respectively. Before we delve into a deep discussion about the individual accidents, I would like to provide some foundational features and terminologies in the field of nuclear power to aid your understanding.
The main materials used in nuclear reactors are: Fuel, moderator and coolant.
In all three cases, the nuclear fuel used was low enriched uranium, where the enrichment did not exceed 5%.
A moderator is a material used to slow down the speed of neutrons to enhance their capture by U-235. Light water serves as a moderator for PWRs and BWRs, whereas graphite serves as the moderator for RBMK.
Light water serves as a coolant in all 3 cases.
The Most Effective Option
It is a well-known fact that coal, used to fuel locomotives, triggered the Industrialized Revolution. The same coal helped to sustain and accelerate the revolution for the role it played in the production of cement and steel, very essentials for building infrastructures such as motorways, railways, bridges and sky scrapers. Now we are obliged by the Paris Climate Change Agreement to transit from fossil fuels to low-carbon technologies, which includes nuclear power and renewables (RE). At this stage, let’s refer to the Intergovernmental Panel on Climate Change (IPCC)’s special report on renewables, the SRREN (which stands for “Special Report on Renewable Energy Sources and Climate Change Mitigation”).
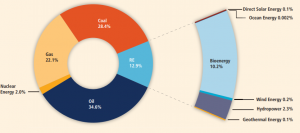
The SRREN report (2012) highlights that the global technical potential of RE sources is substantially higher than global energy demand. It emphasises further that the technical potential of solar energy is the highest out of all the REs sources. A very illustrative Figure SPM.2 in the report shows that in 2008, fossil fuels and nuclear power accounted for 87.1% of the primary energy sources used in that year in all the economic sectors, including electricity production, industries, transportation and domestic. In that year, the share of REs was only 12.9%, dominated by 10.2 and 2.3% from bio-energy and HP respectively. The share from WP was 0.2%, with 0.1% from SP and another 0.1% from geothermal. Out of the 5 mentioned REs, only WP and SP can be described as “inexhaustible” sources which are exploitable. But, their share of only 0.2 and 0.1% of the primary energies used in 2008 were not impressive, as depicted in Figure 1.
A separate report, the 2015 IRENA report, showed that in 2013, the share of the REs in the global power production in 2013 was 22.1%, with 16.4% from hydro power alone. Only 3.6% was from wind and solar power together, the fastest growing energy technologies for decades. Although the installed capacities of wind and solar power grew very remarkably, their resulting generated electricity was woefully low, simply due to their limited effectiveness.
This brings us to the need to appreciate the capacity factors of the different sources of energy. Capacity Factors, CFs are very important for our discussions on the effectiveness of energy, so let’s take this opportunity to have some understanding by calculating values of CFs to appreciate their importance. We shall calculate the CFs for Hydropower (HP), bio-energy, wind power (WP), solar power (SP) and nuclear power (NP), with the raw data from the fact-sheets of a very competent source, the Clean Energy Wire, a German energy magazine.
We are interested in only the installed capacities in GW, and the generated electricity in TWh. Note that in the brackets for the selected energy sources are 2 numbers: the first one is the installed capacity, and the other is the generated electricity: HP (4.8. 18.5), bio-energy (8.2, 44.1), WP (54.5, 105.3), SP (53.1, 50.4) and NP (8.1, 64.3). It is remarkable to note that 8.1GW NP produced 64.3TWh of electricity, which is more than 50.4TWh produced by 53.1GW SP.
To find the CF of NP, we have to divide its generated electricity of 64.3TWh by the product of its installed capacity of 8.1GW and 8760 hours, the number of hours in a year. Thus CF=64.3TWh/(8.1GW x 8760h) =90.6%. In similar manner, the CFs for SP, WP, HP and Bio-energy were found to be 10.8, 22.1, 44.0 and 61.4% respectively. CFs of 10.8 and 90.6 a% for SP and NP respectively explain why 8.1GW NP could generate more electricity than 53.1GW SP. Furthermore, SP is an intermittent energy source like WP.
From the above given fact-sheets, the installed capacities of bio-energy and HP were only 8.2 and 4.5GW respectively in 2020, as compared to their respective values of 6.1 and 5.4GW in 2010, showing slight changes. But, in the same period, the installed capacity of 26.8GW for WP, more than doubled to 54.5GW, while that for SP, 18.0 GW, nearly tripled to 53.1GW. That underscores the fact that WP and SP are the fastest growing energy technologies, but with less impressive generated electricity.
Nuclear energy has been shown beyond reasonable doubt to be clean and safe. It produces reliable and affordable energy more abundantly than any other option. Given these facts, the question of how the SDG 7, which focuses on transitioning to affordable and reliable energy by 2030, can be achieved without the inclusion of nuclear power in the energy mix remains to be seen.


