")
Let’s begin our discussions by emphasizing that solar power (SP), wind power (WP) and nuclear power (NP), the three options for power production, which have been at the centre of our discussions, together with hydropower, (HP), are clean and low-carbon energy sources for the anticipated world without fossil fuels. It is hoped that, with a better understanding of capacity factors, CF, as shown in Fig1, one would readily appreciate that NP is the most effective and realistic option out of the 4 aforementioned energy sources.
With unprecedented damages from recent severe global warming events and the damming IPCC report of August 9th, the coming climate change meeting COP26 at Glasgow in November 2021, will be an extraordinary one. I would stress, among other things, that all nations must phase out fossil fuel, and invest in renewables, which for most certainly means WP and SP. Too many remain silent (or perhaps uniformed?) on NP, the most cost-effective option to replace fossil fuels. It is necessary to have a better appreciation and understanding of capacity factors to underscore that only NP can adequately replace fossil fuels as a baseload electricity generator.
Capacity Factor / Availability Factor
Capacity factor, CF, also referred to as load factor, can also be described as the availability factor, thus the time that a power plant operates at its rated power for a year. For instance, only a hypothetical power plant, with installed capacity of say 1000MW, can operate at its rated power for 8760 hours in a year to produce 1000MW x 8760h = 8760000MWh or 8760GWh of electricity. That implies a CF of 100%, which can’t happen in real life. However, this 8760GWh of electricity can be expressed as the plant’s “theoretical” or possible maximum output. In fact, CF can be defined as the ratio of the actual electricity generated by a plant in a year to its theoretical maximum output in the same period.
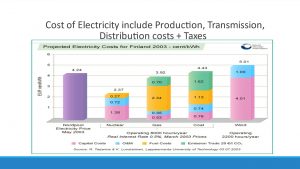
Let’s note that Fig1 represents studies of several relevant factors, which are directly or indirectly related to calculating production cost of electricity. The studies were undertaken by Lappeenranta University of Technology in Finland in 2003. Note that there are five bars in Fig1, where the first bar stands for the unit cost of electricity, which in 2003 in Finland was 4.24 Euro-cents or 4.24Ec. This unit cost is the electricity consumers pay, and covers electricity production cost, transmission & distribution cost as well as taxes, Vat and levies.
The other 4 bars in the figure stand for electricity production costs in the unit price of electricity we pay, and they are for NP, natural gas, coal and WP respectively. Let’s note that the production cost is made up of capital cost, operation & maintenance cost, fuel cost. It also includes a pollution tax for thermal plants based on coal and natural gas. In a prior article, we discussed that WP requires more steel and concrete per MW than NP, which explains why the capital cost, and for that matter, production cost of WP of 5.01Ec in Fig1, is higher than 2.37Ec for NP, and also higher than the retail price of electricity, according to that study, of 4.24Ec.
Comparing the given data for NP and natural gas in Fig1, it is more difficult to build nuclear power reactors due to the huge capital cost. In addition, reactors, according to economies of scale, are built with much high capacity. It is also interesting to note from Fig1 that, after the period of amortization, the production of NP becomes considerably lower.
Fig1 shows “operating 8000 hours/year” in relation to the conventional energy sources of NP, natural gas, and coal. For WP, however, this reads “operating 2200 hours per year”. Since a year is made up of 8760 hours, it follows that the CFs for the conventional sources and WP are 91.3 and 22.1% respectively. Comparing the potentials of two options, say NP and WP, using their capacity factors may be too abstract. It is therefore more convincing when one demonstrates that NP and WP can operate at their rated power of about 8000 and 2200 days in a year respectively. This underlines the fact WP has much less available time to generate electricity when compared to NP.
CFs of both WP and SP are site specific, and they greatly vary from place to place. The CFs for wind turbines and solar panels are based on the respective optimal CFs of WP and SP. Note that the optimal CF for SP happens when the sun peaks around noon, and then steadily decreases and fades away in the early evening.
Capacity Factors in Real Practice
The CFs in power production in real life, especially for natural gas and oil, are greatly influenced by economics. Since natural gas is expensive, it is mostly used during peak demands, when the tariffs are relatively high. Therefore, in practice, CF for natural gas is far less than what is stated in Fig1 for the conventional energy sources. Let’s note that coal and nuclear energy sources are the only 2 options, which are used to generate baseload electricity 24/7, principally due to their relatively low fuel cost.
Besides the fact that coal is the main baseload generator in many countries, it is also used in recent years as the main backup energy source for the intermittent WP and SP, the fastest growing energy used for power generation.
In fact, the pattern of energy sources for power generation, where coal played the central role, is now changing due to mankind’s recently aroused concern on how to avoid the dire consequences associated with global warming. Because we have to wean ourselves from fossil fuels, the current trend is to replace the role of coal with natural gas (the fossil fuel with the lowest emissions foot print, but more expensive than coal) as a backup to WP and SP power generators. With reference to fuel cost in Fig1, can natural gas also replace coal’s role as a baseload electricity producer?
To emphasize this point, let’s consider the CFs of the 4 energy sources (HP, WP, SP and NP) in 3 geographical areas, namely the USA, Germany and China (see Fig2). As a matter of interest, we shall also review data on coal and natural gas among the data for the USA. The data for the USA and China, were extracted from Wikipedia, while those for Germany were taken from the Clean Energy Wire, a German energy magazine. However, the values for capacity factors for the listed energy sources for Germany and China, were calculated using the generated electricity of the product, the installed capacity and 8,760 hours, the total number of hours in a year.
Stated in the tables below for each country, is the installed capacity in gigawatts (GW), followed by generated electricity in TWh, and then CFs presented as a percentage..
UNITED STATES
| Source of power | Installed Capacity (GW) | Generated electricity (TWh) | Capacity Factor (%) |
| Hydro Power | 79.75 | 287.87 | 39.2 |
| Solar Power | 37.32 | 72.23 | 22.1 |
| Wind Power | 103.58 | 300.07 | 33.1 |
| Nuclear Power | 98.07 | 809.41 | 94.2 |
| Coal | 229.24 | 964.96 | 20.8 |
| Natural Gas | 479.14 | 1598.41 | 43.5 |
GERMANY
| Source of power | Installed Capacity (GW) | Generated electricity (TWh) | Capacity Factor (%) |
| Hydro Power | 4.8 | 18.5 | 44.0 |
| Solar Power | 55.1 | 50.4 | 10.8 |
| Wind Power | 54.5 | 105.3 | 22.1 |
| Nuclear Power | 8.1 | 64.3 | 90.6 |
CHINA
| Source of power | Installed Capacity (GW) | Generated electricity (TWh) | Capacity Factor (%) |
| Hydro Power | 370.16 | 1355.2 | 41.8 |
| Solar Power | 253.42 | 261.1 | 11.8 |
| Wind Power | 281.53 | 466.5 | 18.3 |
| Nuclear Power | 49.89 | 366.2 | 83.8 |
On the basis of the above-given data, it is clear from the CFs that NP provides the most realistic option to replace coal as the baseload for electricity generation.


